

- SPEECH
Disinflation in the euro area: an update
Speech by Philip R. Lane, Member of the Executive Board of the ECB, at the University College Dublin Economics Society
Dublin, 15 April 2024
My aim today is to review the recent evolution of inflation in the euro area, together with the implications for monetary policy. The ECB has held the main policy rate (the deposit facility rate) at 4.0 per cent since last September. At last week’s Governing Council meeting, we indicated that, if our updated assessment of the inflation outlook, the dynamics of underlying inflation and the strength of monetary policy transmission were to further increase our confidence that inflation is converging to our target in a sustained manner, it would be appropriate to reduce the current level of monetary policy restriction.[1]
Chart 1 shows the evolution of headline and core inflation since 2019[2]. Let me focus on the disinflation patterns since August 2023. Inflation stood at 5.2 per cent last August and has subsequently declined to 2.4 percent in March. Energy inflation has moved from -3.3 per cent last August to -1.8 per cent in March; food inflation has declined from 9.7 per cent to 2.7 per cent; and core inflation has fallen from 5.3 per cent to 2.9 per cent. Looking at the individual subcomponents of core inflation, there has been a reduction in goods inflation from 4.7 per cent to 1.1 per cent, and in services inflation from 5.5 per cent to 4.0 per cent.
Chart 1
Headline inflation and core inflation
Annual percentage changes
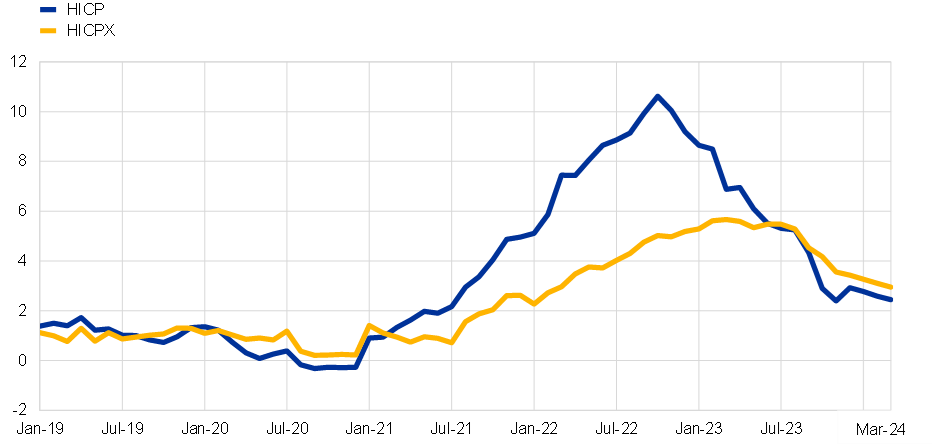
Sources: Eurostat.
Notes: HICP refers to headline inflation and HICPX to HICP excluding food and energy. The latest observations for HICP and HICPX are for March 2024 (flash).
In terms of the array of underlying inflation measures tracked by the ECB, Chart 2 shows the evolution of the refined versions of these measures, which adjust for the dynamic impact of energy shocks and supply bottlenecks.[3] The improvements in these measures since August 2023 suggest that the observed disinflation has a substantial persistent component. At the same time, there has been much less progress in relation to domestic inflation compared to broader inflation measures, reflecting the higher sensitivity of domestic inflation to local cost pressures. As captured in Chart 3, the overall disinflation rate largely reflects the unwinding of the supply shocks that were the primary source of the inflation surge in 2021-2022.
Chart 2
Adjusted measures of underlying inflation
Annual percentage changes

Sources: Eurostat and ECB staff calculations.
Notes: HICP refers to headline inflation, HICPX to HICP excluding food and energy, HICPXX to HICP excluding food, energy, travel-related items and clothing, and PCCI to Persistent and Common Component of Inflation. The “adjusted” measures abstract from energy and global supply bottleneck shocks using a large SVAR, as explained in Bańbura, M., Bobeica, E. and Martínez Hernández, C. (2023), “What drives core inflation? The role of supply shocks”, Working Paper Series, No 2875, ECB. The latest observations are for March 2024 (flash) for HICPX, HICP excluding energy and HICP excluding unprocessed food and energy, and February 2024 for the rest.
Chart 3
Sources of annual price inflation in the euro area
Annual percentage changes and percentage point contributions
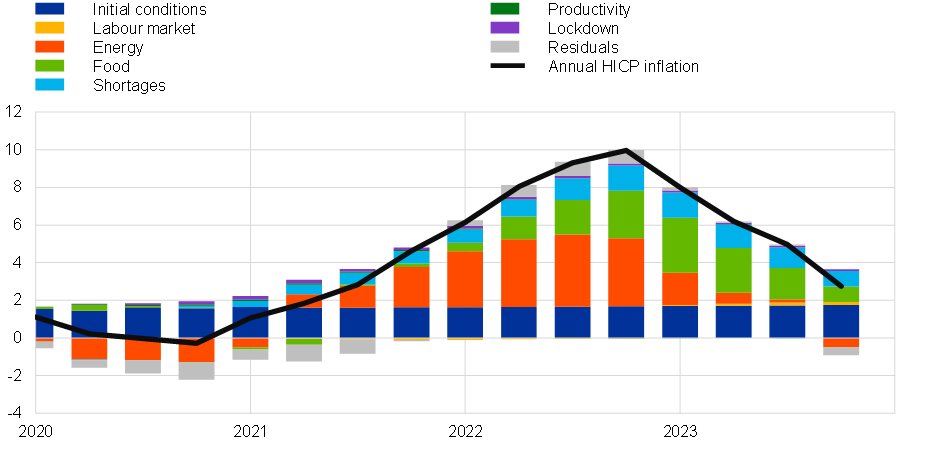
Source: ECB calculations based on Arce, A., Ciccarelli, M., Kornprobst, A. and Montes-Galdón, C. (2024), “What caused the euro area post-pandemic inflation?”, Occasional Paper Series, No 343, ECB.
Notes: The figure shows a decomposition of the sources of annual HICP inflation between the first quarter of 2020 and the fourth quarter of 2023 based on the solution of the full model and the implied impulse response functions. The continuous line shows actual inflation, and the total net heights of the bars are the model’s forecast of inflation in each period, given initial conditions up to the fourth quarter of 2019. The contributions of the residuals are computed as the difference between actual and simulated data. The dark blue portion of each bar shows the contribution of pre-2020 data. The coloured segments of each bar show the general equilibrium, fully dynamic contribution of each exogenous variable to inflation in that period, as implied by the estimated model. Shocks to the rate of change of the relative price of energy and food are constructed as deviations in the values of those variables from zero. Shocks to the shortages variable are constructed as deviations in the values from the sample mean. Shocks to the vacancy-to-unemployment ratio (labour market variable) are constructed as the actual value minus the value in the fourth quarter of 2019.
The role of monetary policy in the disinflation process has been to ensure that the large and persistent but temporary inflation shocks did not mutate into an increase in the medium-term inflation trend through the de-anchoring of inflation expectations. Since 2022, the central tendency distribution of longer-term inflation expectations has remained largely centred at the two percent target, reflecting the general credibility of the ECB’s commitment to delivering its inflation target.[4] Since last summer, a range of measures show that near-term inflation expectations have also come down and that the risk of inflation staying above target in the long term has diminished. Charts 4 to 8 shows the evolution of various indicators of inflation expectations and inflation risk: Chart 4 shows the right tail in the distribution of long-term inflation expectations in the Survey of Professional Forecasters has markedly diminished compared to the peak inflation phase in late 2022; Chart 5 shows that the inflation risk premium embedded in five-year-on-five-year inflation swaps has declined by about 40 basis points since last summer; Chart 6 shows that the option-implied probability of above 2.5 per cent inflation in the five-year-on-five-year interval has dropped, while the option-implied probability of below 1.5 per cent inflation has picked up; Chart 7 shows that, according to the Consumer Expectations Survey, households have recognised the improvement in inflation outcomes and marked down their near-term inflation expectations; finally, Chart 8 shows that, according to the results from the survey on the access to finance of enterprises (SAFE), firms have lowered their near-term inflation expectations, while the proportion of firms that fear high inflation in the medium term has decreased.[5]
Chart 4
Survey of Professional Forecasters (SPF): distribution of longer-term inflation expectations
Percentage of respondents
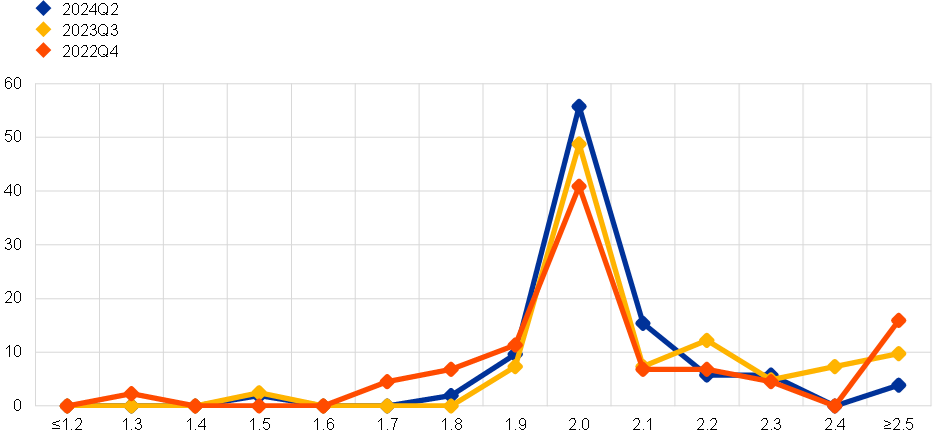
Sources: SPF and ECB calculations.
Notes: The vertical axis shows percentages of respondents; the horizontal axis shows the HICP inflation rate. Longer-term expectations refer to 4-5 years ahead. The latest observations are for SPF for the second quarter of 2024.
Chart 5
Decomposition of five-year-in-five-year inflation-linked swap (ILS) rate
Annual percentage changes

Sources: Bloomberg and ECB calculations.
Notes: Premia-adjusted forward ILS rates are average estimates from two affine term structure models as in Joslin, Singleton and Zhu (2011) applied to ILS rates non-adjusted for the indexation lag; see Burban et al. (2022), Economic Bulletin, Issue 8, ECB, Box 4. The latest observations are for 11 April 2024.
Chart 6
Option-implied probabilities of inflation outcomes
Percentages

Sources: LSEG, Bloomberg and ECB calculations.
Notes: Five-day moving average risk-neutral probabilities of inflation implied by five-year and ten-year zero-coupon inflation options. The depicted probabilities are risk-neutral probabilities affected by risk premia and should therefore not be interpreted as “real world” (or physical) probabilities. The latest observations are for 11 April 2024.
Chart 7
ECB consumer expectations survey
Annual percentage changes

Source: ECB Consumer Expectations Survey (CES).
Notes: The series refer to the median value. The latest observations are for February 2024.
Chart 8
Firms’ expectations about euro area inflation at different horizons
Percentages per annum

Sources: Survey on the access to finance of enterprises (SAFE) and ECB calculations.
Notes: Survey-weighted median, mode and interquartile ranges of firms’ expectations about euro area inflation in one year, three years and five years respectively. Quantiles are computed by linear interpolation of the mid-distribution function. All enterprises. The latest observations are for March 2024.
The lowering of perceived inflation risk is plausibly connected to the faster-than-expected decline in inflation in recent months, which has provided reassurance that inflation would not remain too far away from target for too long. This is captured in Chart 9, which shows the evolution of the projected 2024 inflation rate over the September, December and March projection rounds. Chart 10 also shows the downward revisions to the 2024 growth rate over these projection rounds.
Chart 9
Inflation in 2024
Annual percentage changes
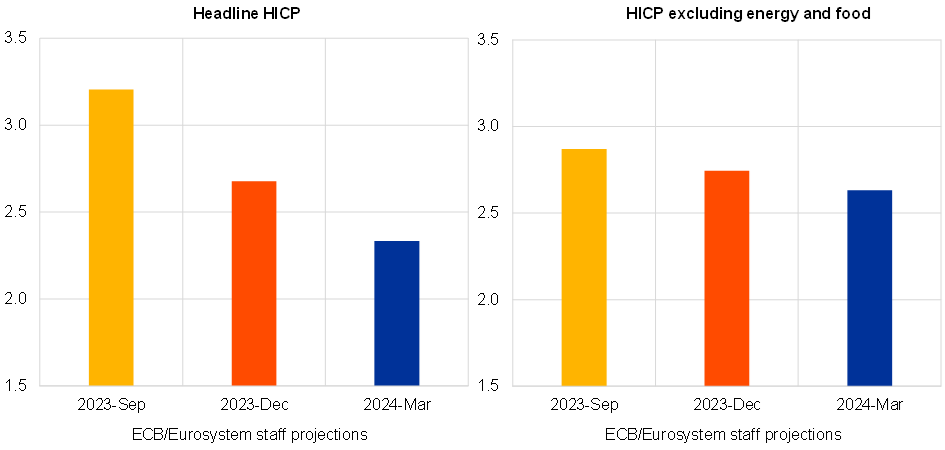
Source: ECB and Eurosystem staff projections.
Chart 10
Real GDP growth in 2024
Annual percentage changes

Source: ECB and Eurosystem staff projections.
Despite the overall disinflation trend, services inflation remains high at 4.0 per cent. The decline in services inflation since last summer has largely been in non-labour-intensive services sectors, reflecting the indirect impact of lower energy prices, the easing of supply bottlenecks and the fading out of pandemic reopening effects on these sectors. As shown in Chart 11, there is a relatively tight medium-term relation between wage inflation and the inflation rate for labour-intensive services sectors (which make up a large part of the domestic inflation component). Over time, deceleration in wage growth is necessary in order for services inflation to converge to a rate that is consistent with meeting the two per cent target for overall inflation.
Chart 11
Services inflation developments
Annual percentage changes

Sources: Eurostat and ECB calculations.
Latest observations are for the fourth quarter of 2023 for compensation per employee, March 2024 (flash) for services inflation and February 2024 for the rest.
Wage pressures are gradually moderating but remain elevated compared to a steady-state benchmark. As shown in Chart 12, annual growth in compensation per employee decelerated in the fourth quarter of last year to 4.6 per cent, from 5.1 per cent in the third quarter. Growth in compensation per hour also slowed, falling in annual terms to 4.4 per cent in the fourth quarter from 5.0 per cent in the third quarter. The wages and salaries component of the labour cost indicator decreased to 3.3 per cent in the fourth quarter from 5.1 per cent in the third quarter. Annual unit labour cost growth fell to 5.8 per cent, from 6.5 per cent, but remained high, in part reflecting weak productivity growth. Negotiated wage growth including one-off payments also declined further, falling to 3.2 per cent in January from 4.8 per cent in December, although this figure does not yet include the data for France and Italy.
Chart 12
Labour cost indicators
Annual percentage changes and percentage point contributions
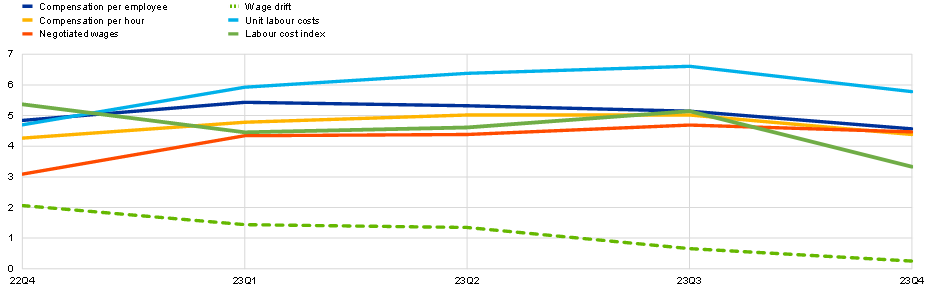
Sources: Eurostat, ECB and ECB staff calculations.
Notes: The labour cost index refers its wages and salaries component. The latest observations are for the fourth quarter of 2023.
As shown in Chart 13, forward-looking wage trackers also continue to provide signs of easing. As shown in Charts 14 and 15, the feedback from firms participating in the Corporate Telephone Survey (CTS) and the SAFE point to lower wage growth this year. The March projections foresee subsequent phases of further wage deceleration in 2025 and 2026, with the growth rate of compensation per employee declining from 5.3 per cent in 2023 to 4.5 per cent in 2024, 3.6 per cent in 2025 and 3.0 per cent in 2026.
Chart 13
Annual percentage changes
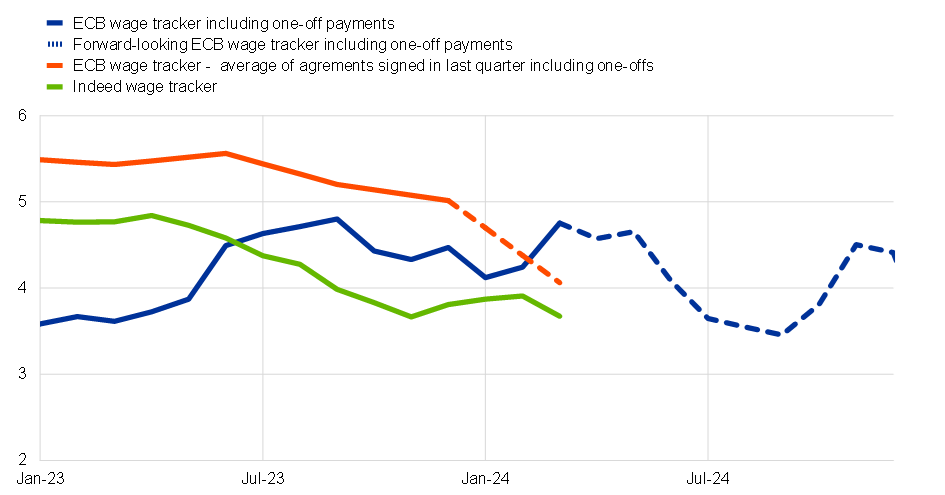
Sources: ECB, national central banks, Central Band of Ireland and the Dutch employer association (AWVN).
Notes: Euro area aggregate based on Germany, France, Italy, Spain, Netherlands, Austria and Greece. The indicator "average of agreements signed in last quarter including one-offs" displays the average growth rate of contracts signed in a given quarter in the first four quarters of signing. One-off payments are spread over the 12 months from the disbursement date. The latest observations are for the first quarter of 2024 (preliminary) for the latest agreements, and March 2024 for the wage trackers.
Chart 14
CTS wage expectations
Number of responses

Sources: ECB and April 2024 Corporate Telephone Survey (CTS).
Note: 54 responses for 2023 and 53 responses for 2024.
Chart 15
SAFE wage expectations for one year ahead
Percentage changes over the next 12 months

Sources: Survey on the access to finance of enterprises (SAFE) and ECB calculations.
Notes: Survey-weighted mean euro area firm expectations of changes in wages of current employees. Computed after trimming at the wave-country-specific 1st and 99th percentiles – all enterprises. The latest observations are for March 2024.
In addition to wage growth deceleration, the convergence of inflation to the target also requires compression in profits. As reflected in Chart 16, annual growth in unit profits decelerated further in the fourth quarter, falling to 2.8 per cent from 4.7 per cent in the third quarter. This significant decline was the main driver of the reduction in the annual growth rate of the GDP deflator, which fell by 0.6 percentage points to 5.3 per cent. As embedded in the March projections exercise, further compression in profits is required to support the convergence of inflation to the target, and a sufficiently restrictive monetary policy stance is necessary to provide the dampened demand conditions to limit the pass-through of rising costs to consumer prices.
Chart 16
GDP deflator
Annual percentage changes and percentage point contributions

Sources: Eurostat and ECB calculations.
Notes: Unit taxes reflect taxes minus subsidies. When the contribution of subsidies on products is larger than the contribution of indirect taxes, the unit tax contribution turns negative. The latest observations are for the fourth quarter of 2023.
In monitoring the transmission of the monetary policy stance, Chart 17 records the policy rate time series (together with the market-priced forward path) and Chart 18 the contraction in the Eurosystem balance sheet; Chart 19 depicts the evolution of the risk-free yield curve; Chart 20 plots bank lending rates for firms and households; Charts 21 and 22 report credit standards for firms and households; finally, Charts 23 and 24 report credit volumes for firms and households.
Chart 17
€STR forward curve and deposit facility rate (DFR); APP, PEPP and TLTROs
Percentages per annum
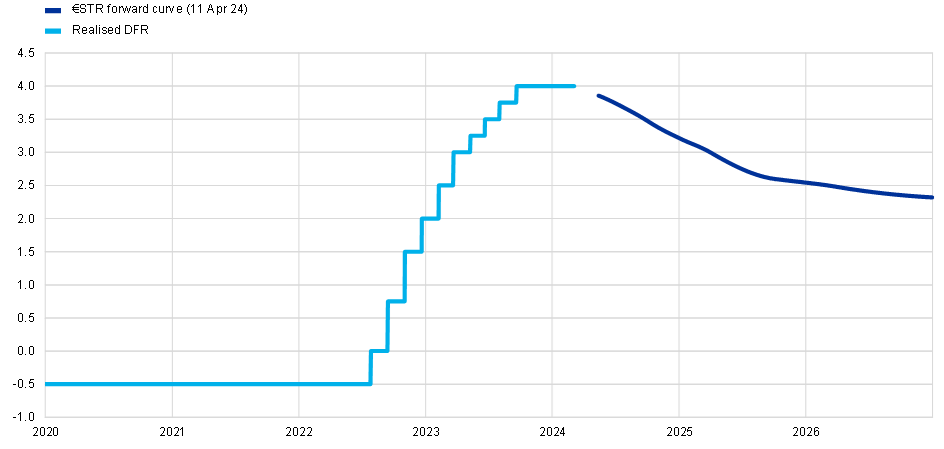
Sources: Bloomberg and ECB calculations.
Note: The latest observation is 11 April 2024.
Chart 18
APP, PEPP and TLTROs
Trillion euros
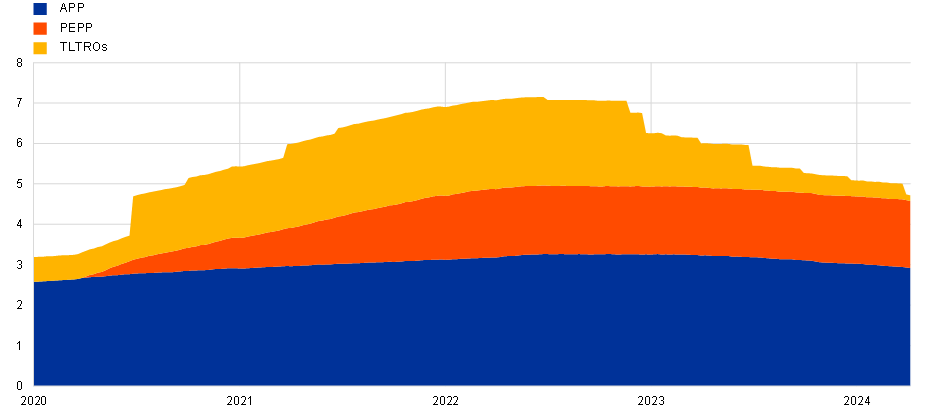
Sources: ECB calculations.
Note: Purchase programmes are based on book value at amortised cost. The latest observation is 5 April 2024.
Chart 19
Euro area Overnight Index Swap (OIS) yield curve
annual percentages
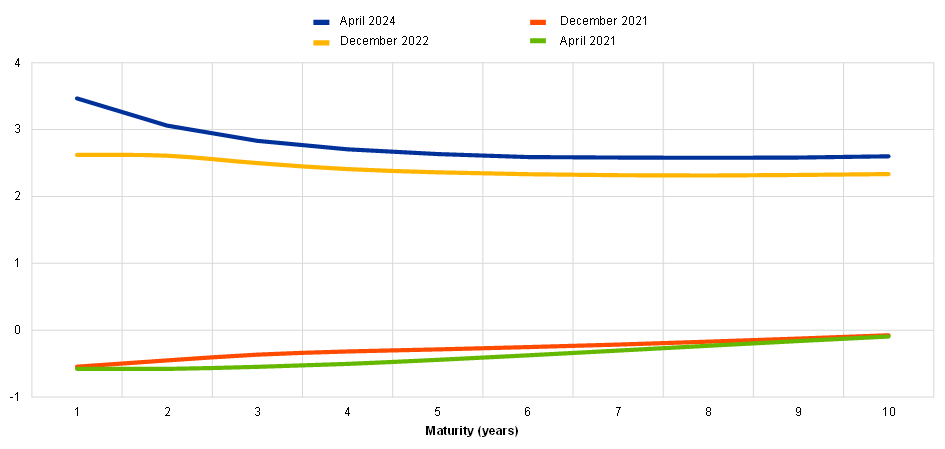
Sources: Bloomberg and ECB calculations.
Notes: The curves refer to 21 April 2021, 15 December 2021, 14 December 2022 and 11 April 2024 respectively. The latest observations are for 11 April 2024.
Chart 20
Lending rates for new and outstanding amounts: firms and households for house purchase
percentages per annum

Source: ECB (MIR).
Notes: Interest rates on new business volumes refer to the indicator for the total cost of borrowing for firms and households for house purchase, which is calculated by aggregating short-term and long-term rates on new business using a 24-month moving average of new business volumes. The latest observations are for February 2024.
Chart 21
Change in credit standards and demand for loans to firms, and contributing factors
net percentages of banks
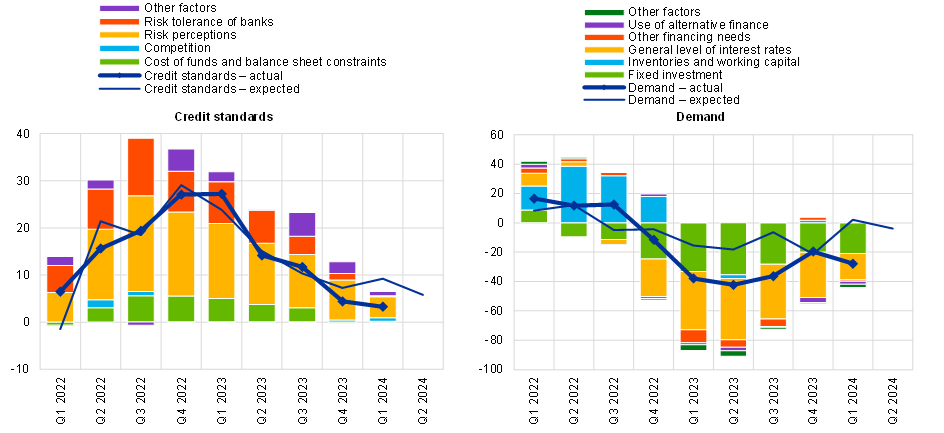
Source: ECB (BLS).
Notes: Left panel: “Other factors” refer to further factors mentioned by banks as having contributed to change in credit standards. Right panel: “Other financing needs” is the unweighted average of “M&A and corporate restructuring” and “debt refinancing/restructuring and renegotiation”; “Use of alternative finance” is the unweighted average of “internal financing”, “loans from other banks”, “loans from non-banks”, “issuance/redemption of debt securities” and “issuance/redemption of equity”.
The latest observations are for the first quarter of 2024.
Chart 22
Change in credit standards and demand for loans to households for house purchase, and contributing factors
net percentages of banks

Source: ECB (BLS).
Notes: Left panel: “Other factors” refer to further factors mentioned by banks as having contributed to change in credit standards. Right panel: “Other financing needs” is the unweighted average of “debt refinancing/restructuring and renegotiation” and “regulatory and fiscal regime of housing markets”; and “Use of alternative finance” is the unweighted average of “internal finance of house purchase out of savings/down payment”, “loans from other banks” and “other sources of external finance”. The net percentages for “Other factors” refer to an average of the further factors which were mentioned by banks as having contributed to changes in loan demand.
The latest observations are for the first quarter of 2024.
Chart 23
Net debt financing flows of euro area firms
left scale: average monthly flows, in EUR billions; right scale: annual percentage changes
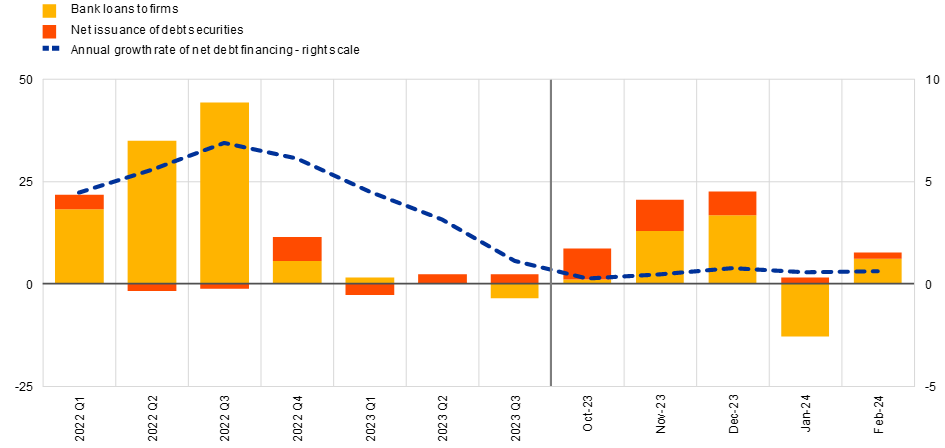
Sources: ECB (BSI, CSEC) and ECB calculations.
Notes: The net issuance of debt securities is seasonally adjusted internally. Bank loans to firms are adjusted for sales, securitisation and cash pooling. The latest observations are for February 2024.
Chart 24
Bank loans to households
left scale: average monthly flows, in EUR billions; right scale: annual percentage changes
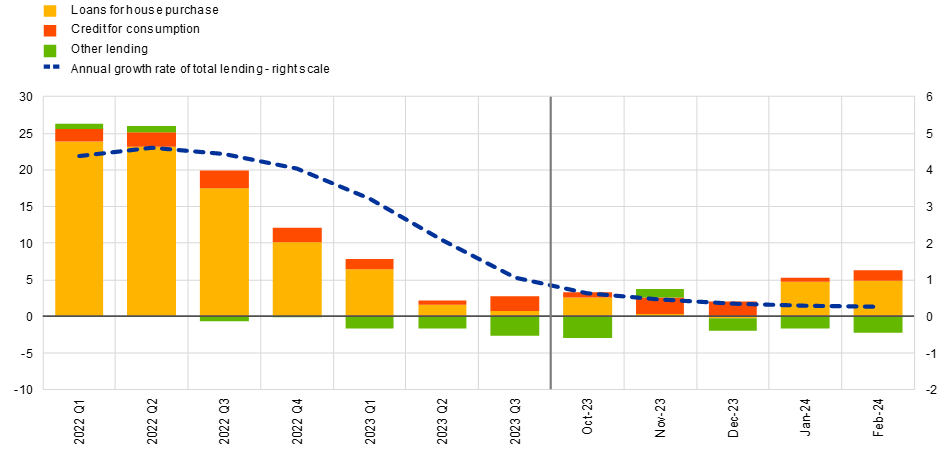
Sources: ECB (BSI) and ECB calculations.
Notes: Bank loans to households are adjusted for sales and securitisation. The latest observations are for February 2024.
Finally, it should be recognised that the current phase of disinflation is necessarily bumpy. In particular, the swings in energy prices during 2023 will generate oscillations in base effects in the monthly inflation readings, while the staggered reversal of various temporary fiscal supports will also operate on the price level in an uneven manner. Chart 25 plots a range of indicators of near-term inflation dynamics and the projected quarterly evolution of headline and core inflation according to the March projections. Headline inflation is expected to fluctuate around current levels in the near term on account of base effects in the energy component and the reversal of the upward effect of the early timing of Easter on services inflation in March. While services inflation should decline somewhat in the near term, it is expected to remain relatively elevated for most of this year.
Chart 25
Short-term forecasts for HICP (left) and HICPX (right)
Annual percentage changes
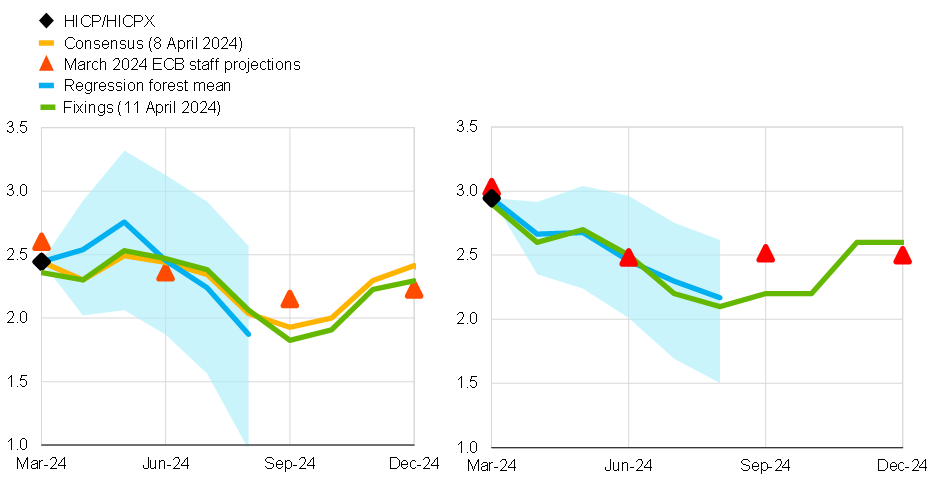
Sources: Eurostat, March 2024 ECB staff macroeconomic projections for the euro area, Consensus Economics, Bloomberg and ECB calculations.
Notes: The cut-off date is 3 April 2024 for the regression forest and 11 April 2024 for fixings. Consensus Economics data were collected on 8 April 2024. The quantile regression forest estimates are from Lenza, M., Moutachaker, I. and Paredes, J. (2023), “Density forecasts of inflation: a quantile regression forest approach”, Working Paper Series, No 2830, ECB. The HICP fixings are observed market prices. The HICPX fixings are estimated based on the model in Grønlund, A.M., Jørgensen, K. and Schupp, F. (2024), “Measuring market-based core inflation expectations”, Working Paper Series, No 2908, ECB. The latest actual observation is for March 2024 (flash).
Even if the near-term inflation outlook is somewhat bumpy, the projected convergence of inflation to the target in 2025 will be underpinned by: the lowering of labour cost pressures; some additional compression of unit profits; the dissipation of the adverse effects of past energy shocks, supply bottlenecks and the pandemic re-opening; and the further unfolding of the disinflationary impact of the restrictive monetary policy stance. This disinflationary dynamic is consistent with both inflation stabilising at our target in 2025 and a substantial economic recovery, with rising real incomes and improvements in the terms of trade, together with the prospect of dis-inflation unlocking future interest rate reductions, boosting domestic consumption and investment, while the normalisation of foreign demand will facilitate growth in exports.
This review of the disinflation path in recent months and the analysis of the drivers of inflation over the projection horizon indicate that, based on the three elements of our reaction function we can conclude that the key ECB interest rates are at levels that are making a substantial contribution to the ongoing disinflation process. Our future decisions will ensure that our policy rates will stay sufficiently restrictive for as long as necessary. If our updated assessment of the inflation outlook, the dynamics of underlying inflation and the strength of monetary policy transmission were to further increase our confidence that inflation is converging to our target in a sustained manner, it would be appropriate to reduce the current level of monetary policy restriction. In informing this assessment, the June Governing Council meeting will benefit from updated staff projections and the accumulation of data about the dynamics of wages and profits in the opening months of this year. In any event, we will continue to follow a data-dependent and meeting-by-meeting approach to determining the appropriate level and duration of restriction, and we are not pre-committing to a particular rate path.
On navigating the transition from the “holding” phase to the “dialling back” phase of the tightening cycle of monetary policy, see Lagarde, C. (2024), “Building confidence in the path ahead”, speech at The ECB and its Watchers XXIV Conference, organised by the Institute for Monetary and Financial Stability, Goethe University, Frankfurt am Main, 20 March.
I maintain a narrow focus in this speech on the patterns since August 2023. I recently provided a comprehensive overview of the disinflation process in Lane, P.R. (2024), “Disinflation in the euro area”, speech at the Hutchins Center on Fiscal & Monetary Policy at the Brookings Institution, Washington, D.C., 8 February.
See M. Banbura, E. Bobeica, K. Bodnar, B. Fagandini, P. Healy and J. Paredes, Underlying inflation measures; an analytical guide for the euro area, Economic Bulletin Issue 5, 2023. While domestic inflation is not to be interpreted as a measure of the underlying rate of aggregate inflation, it is still useful to include it since domestic inflation should be more sensitive to the domestic monetary stance and it tends to be more persistent than the imported component of inflation.
In fact, the inflation surge initially served to “re-anchor from below” inflation expectations at the target: until 2022, a significant proportion of professional forecasters (and market participants) believed that the ECB would not be able to bring inflation up to the target, in view of the effective lower bound constraint.
In terms of their own pricing intentions, firms report that price increases will be lower in 2024 compared to 2023.
Európai Központi Bank
Kommunikációs Főigazgatóság
- Sonnemannstrasse 20
- 60314 Frankfurt am Main, Németország
- +49 69 1344 7455
- media@ecb.europa.eu
A sokszorosítás a forrás megnevezésével engedélyezett.
Médiakapcsolatok