


Published as part of the ECB Economic Bulletin, Issue 6/2023.
Consumers’ perceptions of the factors driving inflation can be an important determinant of their economic behaviour and their inflation expectations. In general, individual beliefs driven by prevailing narratives have an impact on both actions and expectations.[1] One such narrative that can impact economic behaviour is beliefs about the sources of inflation. The question of what is mainly behind rising prices has become more acute of late.[2] This matters, as it can affect consumer expectations about future inflation and their actual behaviour.[3] Against this backdrop, in June 2023 the ECB’s Consumer Expectations Survey asked consumers what they believed was the main factor driving changes in the general level of prices for goods and services in their country over the past 12 months.[4] They were offered three possible answers, reflecting the three main accounting factors that can drive pricing from the corporate side (profits, wages and other input costs).[5]
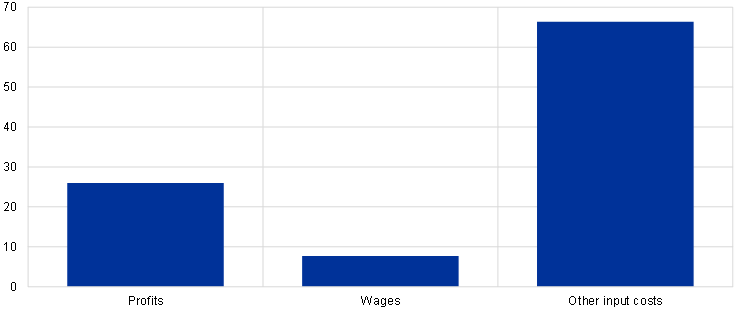
Most consumers believe that price changes were mainly driven by input cost factors, with corporate profits ranked second and wages third. Chart A panel a) shows the distribution of responses. Other (non-wage) input costs, which includes energy and intermediate inputs, was chosen by a clear majority of respondents (around 65%). Firms’ profits ranked second as an explanation, with around 25% of respondents choosing this option, and wages third with 8%. The relative ranking of options was consistent across countries and all possible demographic breakdowns.[6]
Chart A
Perceived main drivers of inflation
a) Overall
(percentages of consumers)
b) Breakdown by selected respondent group
(percentage points, difference in share of responses)

Source: ECB (Consumer Expectations Survey).
Notes: Panel a: weighted estimates. Share of respondents choosing each option. Panel b: weighted estimates. Differences in the share of each option by group. High financial literacy is set against non-high financial literacy (i.e. scores below 4 in the 1-5 scale). High education is considered as a bachelor’s degree or higher, and the responses are set against all others. Price-setters are a subset of respondents who indicated that they have specific management responsibilities for price-setting and contract-related matters in particular.
Knowledge of the pricing strategies of firms as well as higher levels of financial literacy and education are associated with other input costs being more frequently indicated as the main driver. Chart A panel b) shows how the results change for specific characteristics of the respondents. Respondents in management positions with explicit price-setting and contract-related responsibilities (which means they have knowledge of pricing strategies) tend to respond more frequently than others that other inputs were the main reason.[7] A similar picture emerges when looking at respondents with high levels of financial literacy or education.
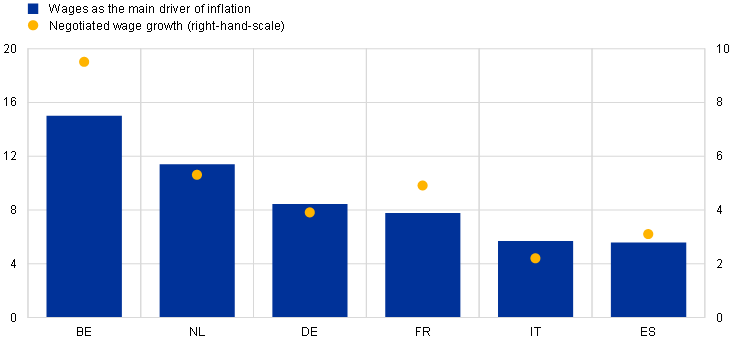
Although wages were ranked third (i.e. lowest) across all countries, there is a correlation between country-specific beliefs and wage developments in the country concerned. While wages were ranked lowest across all countries, there are some cross-country differences. Less than 6% of respondents from Spain and Italy chose wages as the main factor, whereas more than 10% opted for wages in Belgium and the Netherlands. Chart B panel a) shows the responses by country together with the actual figures for negotiated wage growth. Belgium and the Netherlands, which have higher percentage growth in actual wages, also have the higher number of respondents choosing wages as the main driver of inflation.
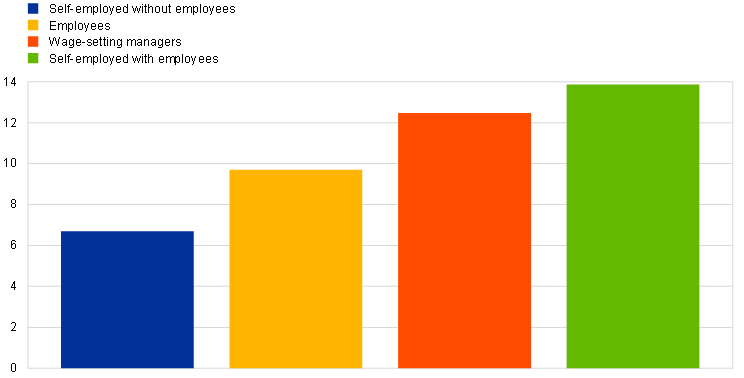
Respondents with wage-setting responsibilities are more likely to select wages as the main driving factor. Chart B panel b) ranks the wage option by group. Those who play an active role in setting wages are indeed more likely to choose this option. This might reflect a greater awareness of the importance of wages in firms’ cost structures compared with consumers who only observe their personal incomes. More specifically, managers with wage-setting responsibility and respondents who are classified as self-employed with employees are more likely to choose wages as the main driver. By contrast, employees and self-employed without employees tend to refer to wages as the main driver less often.
Chart B
Wages perceived as the main driver of inflation
a) Breakdown by country
(percentage of respondents, annual percentage changes)
b) Breakdown by selected respondent group
(percentage of respondents)
Source: ECB (Consumer Expectations Survey).
Notes: Panel a: weighted estimates. “Negotiated wage growth” refers to the annual growth rate in negotiated wages in the first quarter of 2023, including one off payments. Panel b: weighted estimates. Share of respondents in each group choosing wages as the main driver of inflation. Self-employed is split into those with and without employees. Wage-setting managers are a subset of the respondents who specifically indicate that they have wage-setting responsibilities.
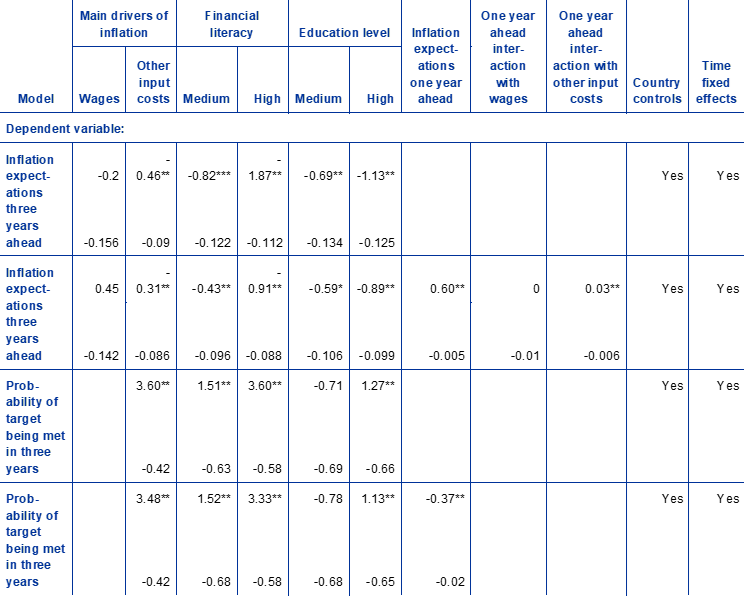
Respondents stating that other input costs are the main driver expect inflation to be less persistent. Specifically, they tend to have lower medium-term inflation expectations and a lower pass-through from short-term expectations to medium-term expectations. Table A quantifies the correlation between answers and medium-term inflation expectations (controlling for education, financial literacy, country and time fixed effects).[8] The results suggest that the input cost explanation is associated with a lower level of medium-term expectations, averaging 0.46 percentage points, compared with a base group of respondents selecting profits as the main factor. Additionally, looking at the pass-through from short-term expectations to medium-term expectations, the conditional impact of respondents answering “other input costs” reflects a pass-through rate of 32% compared with an unconditional pass-through rate of 60%.[9] Finally, the expected probability of the ECB maintaining price stability is 3.5-3.6 percentage points higher for respondents answering “other input costs” rather than the other two options. This positive association is stronger than the association with education, financial literacy or income.
Table A
Inflation expectations and drivers of inflation
Source: ECB (Consumer Expectations Survey).
Notes: Weighted estimates. The sample captures most of the respondents to the drivers of inflation question (around 9,500), excluding only a few observations that were not matched. Categories are shown in relation to the base category, which is “profits” for the answers and “low” for financial literacy and education. Financial literacy is defined as: low = scores 1-2, medium = 3, high = 4-5. Education is defined as: low = up to lower secondary, medium = high school up to university, high = tertiary education.
* denotes significance at a 10% level. ** denotes significance at a 5% level. *** denotes significance at a 1% level.
The choice of “other input costs” as the main driver of inflation correlates with consumers reporting beliefs that the ECB will be able to maintain price stability in three years’ time. The view that other input costs are the main factor (and therefore the likelihood that respondents interpret inflation drivers as being more transitory) strongly correlates with consumers’ beliefs that the ECB will be able to deliver price stability in three years’ time.[10] Chart C shows that the perceived median probability of the ECB maintaining price stability in three years’ time is highest when the “other input costs” explanation is chosen. It is lower when wages are chosen and lowest when profits are chosen as the main factor driving inflation.
Chart C
Perceived likelihood of the ECB maintaining price stability in three years’ time and beliefs about the sources of inflation
(percentage points)

Source: ECB (Consumer Expectations Survey).
Notes: Weighted estimates. Bars report the median probability by factor minus the overall median probability. Probabilities or likelihood that the ECB will maintain price stability calculated, by answers to the question: “How likely do you think it is that the European Central Bank (ECB) will maintain price stability in the euro area economy over the next 3 years?”. Possible answer range 1-100.
All in all, this new evidence from the Consumer Expectations Survey suggests that perceptions about the main drivers of current inflation are associated with how consumers form their medium-term inflation expectations. While most respondents viewed other input costs as the main driver of inflation in the 12 months to June 2023, whether profits or wages are perceived as a more prominent driver warrants close monitoring going forward. It will also be useful to track whether this would be associated with a potential upward impact on medium-term inflation expectations and with a reduced perceived likelihood of the ECB being able to maintain price stability over the medium term.
For how narratives drive events and behaviour, see, for example, Shiller, R.J., Narrative Economics: How Stories Go Viral and Drive Major Economic Events, Princeton University Press, 2019.
See Lagarde, C., “Breaking the persistence of inflation”, speech at the ECB Forum on Central Banking 2023 on “Macroeconomic stabilisation in a volatile inflation environment” in Sintra, Portugal, 27 June 2023; Bernanke, B. and Blanchard, C., “What Caused the U.S. Pandemic-Era Inflation?”, paper prepared for the “The Fed: Lessons learned from the past three years” conference at the Hutchins Center on Fiscal & Monetary Policy at the Hutchins Institution, 23 May 2023; Hansen, N.-J., Toscani, F. and Zhou, J., “Europe’s Inflation Outlook Depends on How Corporate Profits Absorb Wage Gains”, IMF Blog, International Monetary Fund, 26 June 2023.
If, for example, consumers believe that inflation is due to higher input costs (e.g. energy and raw material prices), they likely hold a more transitory view of inflation. This may lead inflation expectations to converge more quickly on the target. At the same time, if they believe that wages or profits are the main driver of inflation, this might imply more persistent and de-anchored future inflation expectations. Additionally, when consumers perceive that high prices are due to input costs for firms, they might be more willing to pay higher prices than if they think that firms’ profits are the main driver.
The question reads: “According to your view, what is the main factor driving the change in the general level of prices for goods and services in your country during the past 12 months”. The options were: “1. The main driver is firms’ profits”, “2. The main driver is wage costs for firms”, “3. The main driver is other input costs for firms (e.g. energy, raw material or other business costs)”. The sample included the six largest euro area economies (Belgium, Germany, Spain, France, Italy and the Netherlands) and consists of 10,308 responses across all countries (Belgium: 845, Germany: 1,797, Spain: 2,268, France: 2,264, Italy: 2,267, the Netherlands: 867).
Owing to the possibility of order effects, which could result in respondents favouring the first or last option, the ordering of the options was randomised for the more than 10,000 respondents. While the ordering of the options had a statistically significant impact on the responses, it was economically small and had no meaningful impact on the aggregate averages or rankings across the three options.
The relative ranking of the options is unchanged for every possible breakdown. While there are some differences in magnitudes across demographics, these do not alter the rankings.
Respondents with management responsibilities (either price- or wage-setting) account for around 14.5% of the matched sample. In more detail, respondents with management positions with contract-related and price-setting responsibilities account for 11.7% (N=1,065) of the total matched sample, while respondents with wage-setting responsibilities account for 6.4% (N=582) of the matched sample.
We control for some other variables that may affect inflation expectations in an attempt to identify the pure effect of the belief in what drives inflation and not possible confounding factors like education or financial literacy.
To calculate the conditional impact, we add the pass-through of one year ahead expectations to three-years ahead expectations (0.60) with the answer 3 dummy (-0.31) and the interaction term (0.03). The marginal effect increases (0.03) as the one year expectation increases, but it starts from a significantly lower level (-0.31) for the respondents who chose “other input costs” as the main driver.
The unconditional median probability currently stands at 42%. It is, however, hard to interpret this indicator without a longer time series. The analysis therefore focuses on the cross-sectional differences. The underlying indicator was devised in the context of a research project aimed at examining the effectiveness of the ECB’s communication regarding its 2021 strategy review; see Ehrmann, M., Georgarakos, D. and Kenny, G., “Credibility gains from communicating with the public: evidence from the ECB’s new monetary policy strategy”, Working Paper Series, No 2785, ECB, 2023.