
- STATISTICAL RELEASE
Euro area quarterly balance of payments and international investment position:
first quarter of 2023
4 July 2023
- Current account deficit at €75 billion (0.5% of euro area GDP) in four quarters to first quarter of 2023, after a €264 billion surplus (2.1% of GDP) a year earlier
- Geographical counterparts largest bilateral current account deficits vis-à-vis China (€158 billion) and Russia (€55 billion) and largest surpluses vis-à-vis United Kingdom (€151 billion) and Switzerland (€74 billion)
- International investment position showed net assets of €332 billion (2.4% of euro area GDP) at end of first quarter of 2023
- Euro area financial assets vis-à-vis Russia amounted to €304 billion (0.9% of euro area external assets) at end of first quarter of 2023, down by 3% since end of previous quarter
Current account
The current account of the euro area recorded a deficit of €75 billion (0.5% of euro area GDP) in the four quarters to the first quarter of 2023, after recording a surplus of €264 billion (2.1% of GDP) a year earlier (Table 1). This change was driven by a switch in the goods balance from a surplus of €184 billion to a deficit of €27 billion and by reductions in the surplus for primary income (down from €118 billion to €8 billion) and services (down from €118 billion to €108 billion). Moreover, the deficit in secondary income edged up from €155 billion to €164 billion.
The lower surplus for services was mainly due to widening deficits for other business services (from €47 billion to €74 billion) and other services (from €24 billion to €54 billion), while larger surpluses were recorded for travel services (from €27 billion to €52 billion), telecommunication, computer and information services (from €137 billion to €149 billion) and insurance, pension and financial services (from €7 billion to €16 billion).
The decrease in the primary income surplus was mainly due to a larger deficit in portfolio equity income (from €66 billion to €112 billion), a lower surplus in direct investment income (from €78 billion to €24 billion) and a decline in the surplus for other primary income (from €8 billion to €0.2 billion), the latter mostly related to an increase in payments to the EU institutions.
Table 1
Current account of the euro area
(EUR billions, unless otherwise indicated; transactions during the period; non-working day and non-seasonally adjusted)

Source: ECB.
Notes: “Equity” comprises equity and investment fund shares. Discrepancies between totals and their components may arise from rounding.
Data on the geographical counterparts of the euro area current account (Chart 1) show that, in the four quarters to the first quarter of 2023, the euro area recorded its largest bilateral deficits vis-à-vis China (€158 billion, up from €98 billion a year earlier), Russia (€55 billion, up from €50 billion) and the residual group of other countries (€51 billion, after a surplus of €91 billion). The largest bilateral surpluses were recorded vis-à-vis the United Kingdom (€151 billion, down from €170 billion) and Switzerland (€74 billion, up from €66 billion). Furthermore, the euro area recorded a bilateral current account deficit of €40 billion vis-à-vis the United States, following a surplus of €58 billion a year earlier.
The most significant changes in the geographical components of the current account in the four quarters to the first quarter of 2023 relative to the previous year were as follows. The deficit for goods vis-à-vis the residual group of other countries rose from €20 billion to €167 billion. This was partly due to a larger goods deficit with Norway (up from €30 billion to €77 billion) and increased imports from countries within the Organization of the Petroleum Exporting Countries, in both cases driven by larger imports of energy products. The deficit vis-à-vis China increased from €136 billion to €183 billion, while the surplus vis-à-vis EU Member States and EU institutions outside the euro area decreased from €65 billion to €38 billion.
In services, the deficit vis-à-vis the United States increased (from €86 billion to €138 billion) mainly on account of larger imports of research and development services, while the surplus vis-à-vis the United Kingdom widened (from €35 billion to €51 billion), mostly owing to exports of travel services. In primary income, a larger deficit was recorded vis-à-vis the United States (up from €37 billion to €82 billion), while the primary income balance vis-à-vis the United Kingdom switched from a surplus of €28 billion to a deficit of €4 billion.
Chart 1
Geographical breakdown of the euro area current account balance
(four-quarter moving sums in EUR billions; non-seasonally adjusted)

Source: ECB.
Note: “EU non-EA” comprises the non-euro area EU Member States and those EU institutions and bodies that are considered for statistical purposes as being outside the euro area, such as the European Commission and the European Investment Bank. “Other countries” includes all countries and country groups not shown in the chart, as well as unallocated transactions.
International investment position
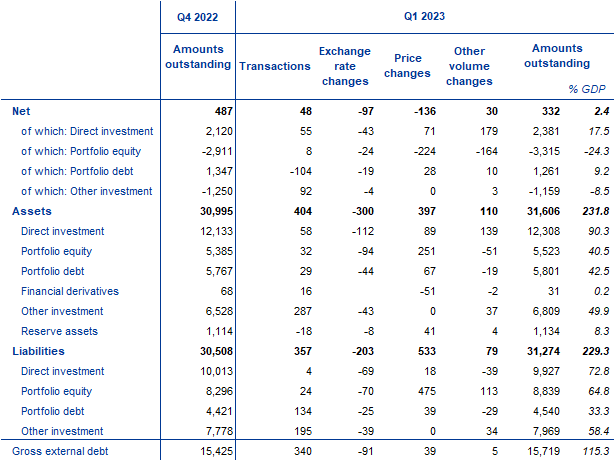
At the end of the first quarter of 2023, the international investment position of the euro area recorded net assets of €332 billion vis-à-vis the rest of the world (2.4% of euro area GDP), down from €487 billion in the previous quarter (Chart 2 and Table 2).
Chart 2
Net international investment position of the euro area
(net amounts outstanding at the end of the period as a percentage of four-quarter moving sums of GDP)

Source: ECB.
The €155 billion decrease in net assets reflected changes in the various investment components. Larger net liabilities were recorded in portfolio equity (up from €2.91 trillion to €3.31 trillion), while net assets declined in portfolio debt (down from €1.35 trillion to €1.26 trillion). These were partly offset by larger net assets in direct investment (up from €2.12 trillion to €2.38 trillion) and lower net liabilities in other investment (down from €1.25 trillion to €1.16 trillion).
Table 2
International investment position of the euro area
(EUR billions, unless otherwise indicated; amounts outstanding at the end of the period, flows during the period; non-working day and non-seasonally adjusted)
Source: ECB.
Notes: “Equity” comprises equity and investment fund shares. Net financial derivatives are reported under assets. “Other volume changes” mainly reflect reclassifications and data enhancements. Discrepancies between totals and their components may arise from rounding.
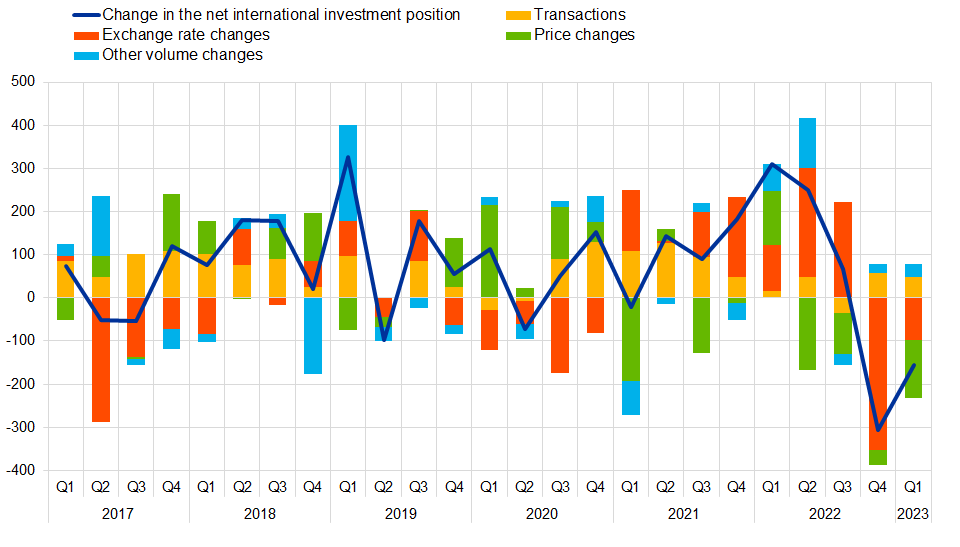
The developments in the euro area’s net international investment position in the first quarter of 2023 were driven mainly by large negative net flows from price changes and exchange rate changes. These were partly offset by transactions and other volume changes (Table 2 and Chart 3).
The increase in net liabilities for portfolio equity was mostly driven by negative net flows for price changes (as the price increase was larger in liabilities than in assets), other volume changes and, to a lesser extent, exchange rate changes (Table 2). The decrease in net assets for portfolio debt resulted mostly from negative net transactions and net exchange rate changes, which were partially offset by positive price changes and other volume changes. In direct investment, the changes were mainly explained by positive net flows owing to other volume changes, price changes and transactions. The decrease in other investment net liabilities was mostly due to positive transactions.
At the end of the first quarter of 2023 the gross external debt of the euro area amounted to €15.7 trillion (approximately 115% of euro area GDP), up by €294 billion compared with the previous quarter.
Chart 3
Changes in the net international investment position of the euro area
(EUR billions; flows during the period)
Source: ECB.
Note: “Other volume changes” mainly reflect reclassifications and data enhancements.
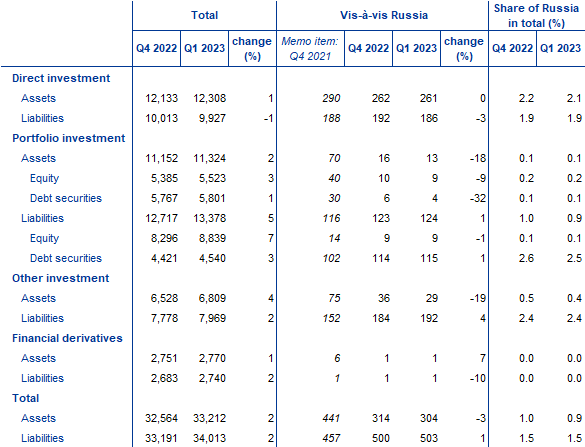
This release provides an overview of the euro area’s international investment position vis-à-vis residents of Russia at the end of the first quarter of 2023 and reports the main changes compared with the previous quarter (Table 3).[1] Euro area financial assets vis-à-vis Russia amounted to €304 billion (0.9% of euro area external assets) at the end of the first quarter of 2023, a 3% decrease since the end of the previous quarter. This decrease was mainly due to other investment assets in Russia which declined by 19%. At the same time, the euro area recorded liabilities of €503 billion vis-à-vis Russia (1.5% of total external liabilities), an increase of 1% compared with the previous quarter, driven mainly by larger liabilities in other investment.
Table 3
International investment position of the euro area – geographical breakdown vis-à-vis Russia
(EUR billions, unless otherwise indicated; at the end of the period; non-working day and non-seasonally adjusted)
Source: ECB.
Notes: “Equity” comprises equity and investment fund shares. “Total assets/liabilities” refer to the sum of direct investment, portfolio investment, other investment and financial derivatives. Reserve assets are not included in the total and financial derivatives are reported separately in gross terms under assets and liabilities. Discrepancies between totals and their components may arise from rounding. Percentage changes refer to changes between the end of the previous quarter and the end of the current quarter.
Data revisions
This statistical release incorporates revisions to the data for the reference periods between the first quarter of 2019 and the fourth quarter of 2022. The revisions reflect revised national contributions to the euro area aggregates as a result of the incorporation of newly available information.
Next releases
- Monthly balance of payments: 20 July 2023 (reference data up to May 2023).
- Quarterly balance of payments and international investment position: 5 October 2023 (reference data up to the second quarter of 2023)
For queries, please use the Statistical information request form.
Notes
- Data are neither seasonally nor working day-adjusted. Ratios to GDP (including in the charts) refer to four-quarter sums of non-seasonally and non-working day-adjusted GDP figures.
- Hyperlinks in this press release lead to data that may change with subsequent releases as a result of revisions.
- Balance of payments statistics are now released using the "BPS" dataset which includes an additional 17th dimension in its data structure definition to specify the type of resident entity.
Table 3 does not include reserve assets in the total euro area external asset positions and financial derivatives are reported in gross terms instead of net terms.