
- PRESS RELEASE
Euro area monthly balance of payments: July 2023
19 September 2023
- Current account recorded €21 billion surplus in July 2023, down from €36 billion in previous month
- Current account surplus amounted to €34 billion (0.2% of euro area GDP) in the 12 months to July 2023, down from €66 billion (0.5%) one year earlier
- In financial account, euro area residents’ net acquisitions of non-euro area portfolio investment securities totalled €207 billion and non-residents’ net acquisitions of euro area portfolio investment securities totalled €419 billion in the 12 months to July 2023
Chart 1
Euro area current account balance
(EUR billions unless otherwise indicated; working day and seasonally adjusted data)
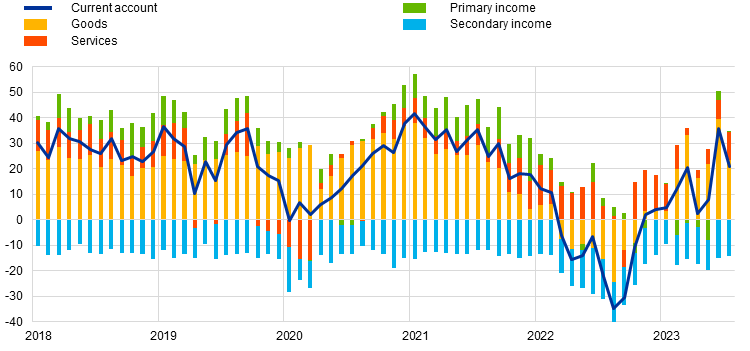
Source: ECB.
The current account of the euro area recorded a surplus of €21 billion in July 2023, a decrease of €15 billion from the previous month (Chart 1 and Table 1). Surpluses were recorded for goods (€23 billion), services (€11 billion) and primary income (€ 1 billion). These were partly offset by a deficit for secondary income (€14 billion).
Table 1
Current account of the euro area
(EUR billions unless otherwise indicated; transactions; working day and seasonally adjusted data)
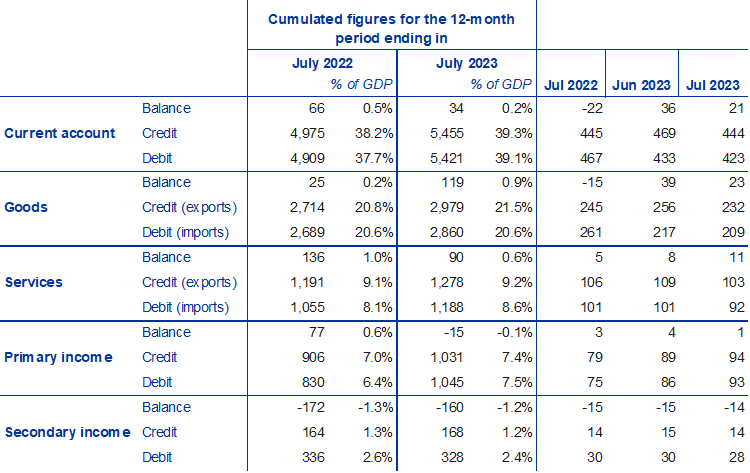
Source: ECB.
Note: Discrepancies between totals and their components may be due to rounding.
In the 12 months to July 2023, the current account recorded a surplus of €34 billion (0.2% of euro area GDP), compared with a surplus of €66 billion (0.5% of euro area GDP) one year earlier. This development was mainly driven by a switch from a surplus (€77 billion) to a deficit (€15 billion) for primary income and by a reduction in the surplus for services (down from €136 billion to €90 billion). These developments were partly offset by a larger surplus for goods (up from €25 billion to €119 billion) and a smaller deficit for secondary income (down from €172 billion to €160 billion).
Chart 2
Selected items of the euro area financial account
(EUR billions; 12-month cumulated data)
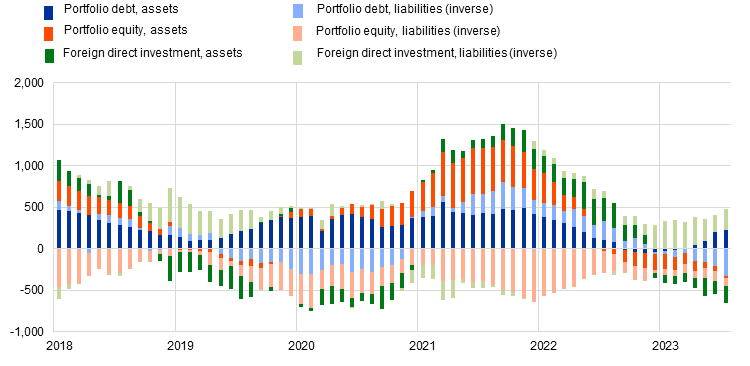
Source: ECB.
Notes: For assets, a positive (negative) number indicates net purchases (sales) of non-euro area instruments by euro area investors. For liabilities, a positive (negative) number indicates net sales (purchases) of euro area instruments by non-euro area investors.
In direct investment, euro area residents made net disinvestments of €205 billion in non-euro area assets in the 12 months to July 2023, following net investments of €284 billion one year earlier (Chart 2 and Table 2). Non-residents disinvested €247 billion in net terms from euro area assets in the 12 months to July 2023, following net disinvestments of €79 billion one year earlier.
In portfolio investment, euro area residents’ net sales of non-euro area equity increased slightly to €25 billion in the 12 months to July 2023, up from €24 billion one year earlier. Over the same period, net purchases of non-euro area debt securities by euro-area residents increased to €233 billion, up from €104 billion one year earlier. Non-residents’ net purchases of euro area equity decreased to €89 billion in the 12 months to July 2023, down from €264 billion one year earlier. Over the same period, non-residents made net purchases of euro area debt securities amounting to €330 billion, following net sales of €228 billion one year earlier.
Table 2
Financial account of the euro area
(EUR billions unless otherwise indicated; transactions; non-working day and non-seasonally adjusted data)
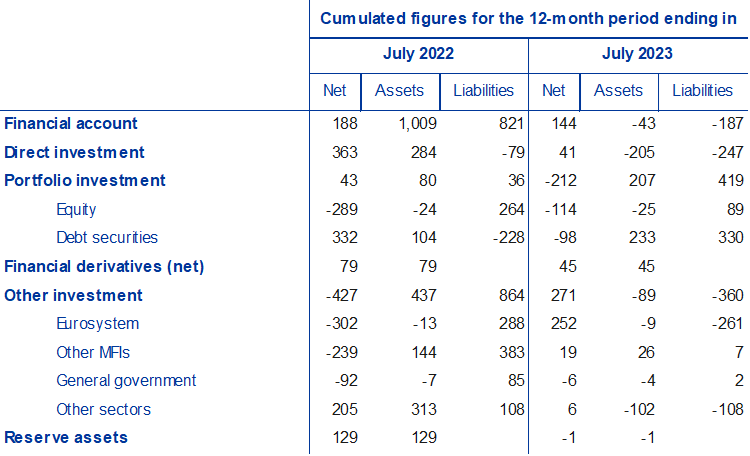
Source: ECB.
Notes: Decreases in assets and liabilities are shown with a minus sign. Net financial derivatives are reported under assets. “MFIs” stands for monetary financial institutions. Discrepancies between totals and their components may be due to rounding.
In other investment, euro area residents recorded net disposals of non-euro area assets amounting to €89 billion in the 12 months to July 2023 (following net acquisitions of €437 billion one year earlier), and they recorded net disposals of liabilities amounting to €360 billion (following net acquisitions of €864 billion one year earlier).
Chart 3
Monetary presentation of the balance of payments
(EUR billions; 12-month cumulated data)
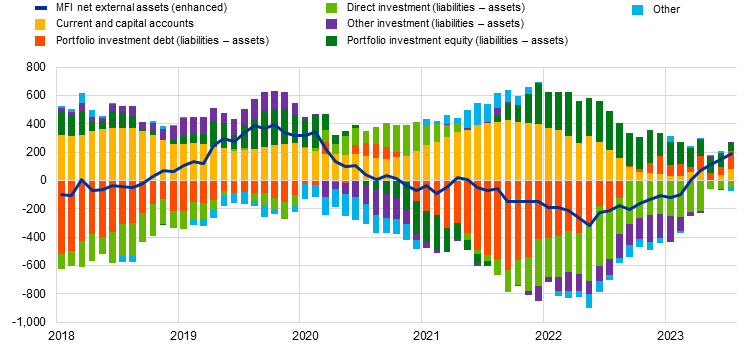
Source: ECB.
Notes: “MFI net external assets (enhanced)” incorporates an adjustment to the MFI net external assets (as reported in the consolidated MFI balance sheet items statistics) based on information on MFI long-term liabilities held by non-residents, available in b.o.p. statistics. B.o.p. transactions refer only to transactions of non-MFI residents of the euro area. Financial transactions are shown as liabilities net of assets. “Other” includes financial derivatives and statistical discrepancies.
The monetary presentation of the balance of payments (Chart 3) shows that the net external assets (enhanced) of euro area MFIs increased by €191 billion in the 12 months to July 2023. This increase was mainly driven by euro area non-MFIs’ net inflows in portfolio investment debt and portfolio investment equity and the current and capital accounts surplus. These developments were partly offset by euro area non-MFIs’ net outflows in direct investment and other flows.
In July 2023 the Eurosystem’s stock of reserve assets increased to €1,109.7 billion up from €1,105.2 billion in the previous month (Table 3). This increase was driven by positive price changes (€8.1 billion) and, to a lesser extent, by net acquisitions of assets (€0.4 billion) which were partly offset by negative exchange rate changes (€4.0 billion).
Table 3
Reserve assets of the euro area
(EUR billions; amounts outstanding at the end of the period, flows during the period; non-working day and non-seasonally adjusted data)
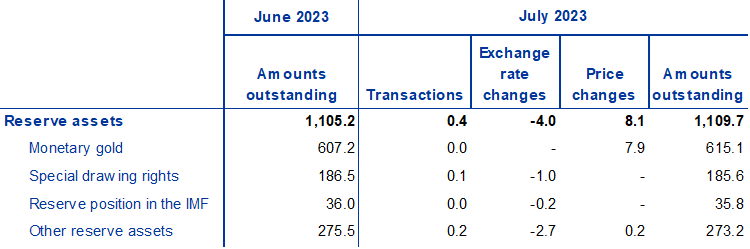
Source: ECB.
Notes: “Other reserve assets” comprises currency and deposits, securities, financial derivatives (net) and other claims. Discrepancies between totals and their components may be due to rounding.
Data revisions
This press release does not incorporate revisions to previous periods.
Next releases:
- Quarterly balance of payments: 5 October 2023 (reference data up to the second quarter of 2023)
- Monthly balance of payments: 19 October 2023 (reference data up to August 2023)
For media queries, please contact Philippe Rispal, tel.: +49 69 1344 5482.
Notes
- Current account data are always seasonally and working day-adjusted, unless otherwise indicated, whereas capital and financial account data are neither seasonally nor working day-adjusted.
- Hyperlinks in this press release lead to data that may change with subsequent releases as a result of revisions.
European Central Bank
Directorate General Communications
- Sonnemannstrasse 20
- 60314 Frankfurt am Main, Germany
- +49 69 1344 7455
- media@ecb.europa.eu
Reproduction is permitted provided that the source is acknowledged.
Media contacts