
Update on economic, financial and monetary developments
Summary
The Governing Council decided at its meeting on 26 October 2023 to keep the three key ECB interest rates unchanged. The incoming information has broadly confirmed its previous assessment of the medium-term inflation outlook. Inflation is still expected to stay too high for too long, and domestic price pressures remain strong. At the same time, inflation dropped markedly in September, including due to strong base effects, and most measures of underlying inflation have continued to ease. The Governing Council’s past interest rate increases continue to be transmitted forcefully into financing conditions. This is increasingly dampening demand and thereby helps push down inflation.
The Governing Council is determined to ensure that inflation returns to its 2% medium-term target in a timely manner. Based on its current assessment, the Governing Council considers that the key ECB interest rates are at levels that, maintained for a sufficiently long duration, will make a substantial contribution to this goal. The Governing Council’s future decisions will ensure that its policy rates will be set at sufficiently restrictive levels for as long as necessary.
The Governing Council will continue to follow a data-dependent approach to determining the appropriate level and duration of restriction. In particular, the Governing Council’s interest rate decisions will be based on its assessment of the inflation outlook in light of the incoming economic and financial data, the dynamics of underlying inflation and the strength of monetary policy transmission.
Economic activity
The euro area economy remains weak. Recent information suggests that manufacturing output has continued to fall. Subdued foreign demand and tighter financing conditions are increasingly weighing on investment and consumer spending. The services sector is also weakening further. This is mainly because weaker industrial activity is spilling over to other sectors, the impetus from reopening effects is fading and the impact of higher interest rates is broadening. The economy is likely to remain weak for the remainder of 2023. But as inflation falls further, household real incomes recover and the demand for euro area exports picks up, the economy should strengthen over the coming years.
Economic activity has so far been supported by the strength of the labour market. The unemployment rate stood at a historical low of 6.4% in August. At the same time, there are signs that the labour market is weakening. Fewer new jobs are being created, including in services, consistent with the cooling economy gradually feeding through to employment.
As the energy crisis fades, governments should continue to roll back the related support measures. This is essential to avoid driving up medium-term inflationary pressures, which would otherwise call for even tighter monetary policy. Fiscal policies should be designed to make the euro area economy more productive and to gradually bring down high public debt. Structural reforms and investments to enhance the euro area’s supply capacity – which would be supported by the full implementation of the Next Generation EU programme – can help reduce price pressures in the medium term, while supporting the green and digital transitions. To that end, the reform of the EU’s economic governance framework should be concluded before the end of this year and progress towards a capital markets union and the completion of the banking union should be accelerated.
Inflation
Inflation dropped to 4.3% in September, almost a full percentage point lower than its August level. In the near term, it is likely to come down further, as the sharp price increases in energy and food recorded in autumn 2022 will drop out of the yearly rates. September’s decline was broad-based. Food price inflation slowed again, although it remains high by historical standards. In annual terms, energy prices fell by 4.6% but, most recently, have risen again and become less predictable in view of the new geopolitical tensions.
Inflation excluding energy and food dropped to 4.5% in September, from 5.3% in August. This fall was supported by improving supply conditions, the pass-through of previous declines in energy prices, and the impact of tighter monetary policy on demand and corporate pricing power. Goods and services inflation rates fell substantially, to 4.1% and 4.7% respectively, with services inflation also being pulled down by pronounced base effects. Price pressures in tourism and travel appear to be moderating.
Most measures of underlying inflation continue to decline. At the same time, domestic price pressures are still strong, reflecting also the growing importance of rising wages. Measures of longer-term inflation expectations mostly stand around 2%. Nonetheless, some indicators remain elevated and need to be monitored closely.
Risk assessment
The risks to economic growth remain tilted to the downside. Growth could be lower if the effects of monetary policy turn out stronger than expected. A weaker world economy would also weigh on growth. Russia’s unjustified war against Ukraine and the tragic conflict triggered by the terrorist attacks in Israel are key sources of geopolitical risk. This may result in firms and households becoming less confident and more uncertain about the future, and dampen growth further. Conversely, growth could be higher than expected if the still resilient labour market and rising real incomes mean that people and businesses become more confident and spend more, or the world economy grows more strongly than expected.
Upside risks to inflation could come from higher energy and food costs. The heightened geopolitical tensions could drive up energy prices in the near term, while making the medium-term outlook more uncertain. Extreme weather, and the unfolding climate crisis more broadly, could push food prices up by more than expected. A lasting rise in inflation expectations above the Governing Council’s target, or higher than anticipated increases in wages or profit margins, could also drive inflation higher, including over the medium term. By contrast, weaker demand – for example owing to a stronger transmission of monetary policy or a worsening of the economic environment in the rest of the world amid greater geopolitical risks – would ease price pressures, especially over the medium term.
Financial and monetary conditions
Longer-term interest rates have risen markedly since the September 2023 meeting, reflecting strong increases in other major economies. The Governing Council’s monetary policy continues to transmit strongly into broader financing conditions. Funding has become more expensive for banks, and interest rates for business loans and mortgages rose again in August, to 5.0% and 3.9% respectively.
Higher borrowing rates, with the associated cuts in investment plans and house purchases, led to a further sharp drop in credit demand in the third quarter, as reported in the October 2023 bank lending survey. Moreover, credit standards for loans to firms and households tightened further. Banks are becoming more concerned about the risks faced by their customers and are less willing to take on risks themselves.
Against this background, credit dynamics have weakened further. The annual growth rate of loans to firms has dropped sharply, from 2.2% in July to 0.7% in August and 0.2% in September. Loans to households remained subdued, with the growth rate slowing to 1.0% in August and 0.8% in September. Amid weak lending and the reduction in the Eurosystem balance sheet, the annual growth rate of M3 fell to ‑1.3% in August – the lowest level recorded since the start of the euro – and still stood at ‑1.2% in September.
Monetary policy decisions
The interest rate on the main refinancing operations and the interest rates on the marginal lending facility and the deposit facility were unchanged at 4.50%, 4.75% and 4.00% respectively.
The asset purchase programme (APP) portfolio is declining at a measured and predictable pace, as the Eurosystem no longer reinvests the principal payments from maturing securities.
As concerns the pandemic emergency purchase programme (PEPP), the Governing Council intends to reinvest the principal payments from maturing securities purchased under the programme until at least the end of 2024. In any case, the future roll-off of the PEPP portfolio will be managed to avoid interference with the appropriate monetary policy stance.
The Governing Council will continue applying flexibility in reinvesting redemptions coming due in the PEPP portfolio, with a view to countering risks to the monetary policy transmission mechanism related to the pandemic.
As banks are repaying the amounts borrowed under the targeted longer-term refinancing operations, the Governing Council will regularly assess how targeted lending operations and their ongoing repayment are contributing to its monetary policy stance.
Conclusion
The Governing Council decided at its meeting on 26 October 2023 to keep the three key ECB interest rates unchanged. The incoming information has broadly confirmed the Governing Council’s previous assessment of the medium-term inflation outlook. Inflation is still expected to stay too high for too long, and domestic price pressures remain strong. At the same time, inflation dropped markedly in September, including due to strong base effects, and most measures of underlying inflation have continued to ease. The past interest rate increases continue to be transmitted forcefully into financing conditions. This is increasingly dampening demand and thereby helps push down inflation.
The Governing Council is determined to ensure that inflation returns to its 2% medium-term target in a timely manner. Based on its current assessment, the Governing Council considers that rates are at levels that, maintained for a sufficiently long duration, will make a substantial contribution to the timely return of inflation to the target. The Governing Council’s future decisions will ensure that the key ECB interest rates will be set at sufficiently restrictive levels for as long as necessary to ensure such a timely return. The Governing Council will continue to follow a data-dependent approach to determining the appropriate level and duration of restriction.
In any case, the Governing Council stands ready to adjust all of its instruments within its mandate to ensure that inflation returns to its medium-term target and to preserve the smooth functioning of monetary policy transmission.
1 External environment
Global economic growth is moderating in the second half of the year. The slowdown in economic activity is particularly pronounced in the services sector, while manufacturing activity remains subdued. The recovery in global trade is ongoing, although recent data suggest that the growth trajectory may be weaker in the coming quarters, in line with the slowdown in economic activity. Pressures on headline inflation have increased slightly at the global level, reflecting rising energy prices. Core inflation continues to decrease.
Global economic activity is moderating. The global composite output Purchasing Managers’ Index (PMI) (excluding the euro area) declined in September for the fourth consecutive month but remained above the neutral threshold. After having been boosted by the post-pandemic reopening of the economy, service sector activity is now slowing down and converging towards the level of activity seen in the manufacturing sector (Chart 1). This loss in economic momentum and the convergence of the services and manufacturing sectors may also reflect delayed effects of monetary policy tightening, as still high inflation and tighter credit conditions continue to put pressure on the disposable income of consumers. At the same time, labour markets are expected to remain strong, supporting demand in the near term.
Chart 1
Global composite output PMI (excluding the euro area)
(diffusion indices)

Sources: Markit and ECB staff calculations.
Note: The latest observations are for September 2023.
Global trade dynamics remain weak. Global merchandise trade recovered in the second quarter of this year from the low levels seen in the first quarter, as the further easing of supply shortages of electrical items and semiconductors supported trade in key sectors such as the automobile industry. However, the PMI data on new export orders and industrial production point to continued weak goods demand. The weakness of global import growth partly reflects the fact that the composition of global demand has become less trade-intensive, as demand has been shifting from goods to services, returning to pre-pandemic patterns. Moreover, the supply disruptions that led to a build-up of inventories after the pandemic have since eased, resulting in destocking, which is weighing on trade growth. At the same time, global trade in goods and services has been supported by the rebound in international tourism, with tourist arrivals in most regions returning to their pre-pandemic levels.
Headline inflation across the member countries of the Organisation for Economic Co-operation and Development (OECD) remains on a downward trajectory, but developments in commodity prices are slowing the pace of disinflation. Annual headline inflation across OECD member countries (excluding Türkiye) increased to 4.5% in August, from 4.4% in July, owing to a less negative contribution from energy prices (Chart 2). Overall, recent developments in energy commodity markets suggest that the disinflationary trend in energy prices may have bottomed out. At the same time, annual core inflation in OECD countries (excluding Türkiye) continued to decline, falling to 4.7% in August from 5.0% in July. However, core inflation remains rather persistent, especially in advanced economies, owing to still resilient labour markets and strong wage growth. Looking ahead, the gradual disinflation should continue as the effects of tighter monetary policy pass through to core inflation.
Chart 2
OECD consumer price inflation
(annual percentage changes, percentage point contributions)

Sources: OECD and ECB staff calculations.
Notes: The OECD aggregate excludes Türkiye and is calculated using OECD consumer price index annual weights. Core inflation refers to inflation for all items excluding food and energy. The latest observations are for August 2023.
Energy commodity price developments have been mixed since the Governing Council’s meeting in September amid lower oil prices and higher gas prices. Oil prices in US dollars have decreased slightly (by 3.2%) since the September meeting (Chart 3), as tighter oil supply was offset by concerns about global demand amid market expectations of higher-for-longer interest rates and softer global economic activity. On the supply side, Russia and Saudi Arabia reiterated their pledge to cut oil production by 1.3 million barrels per day by the end of the year. Oil prices have been more volatile since the terrorist attacks in Israel amid rising uncertainty about the implications of the conflict for oil supplies from the Middle East. There was a sharp increase in the aftermath of the attacks (3.8% as at 9 October), but the increase has since slowed to stand at 0.8%. Despite robust EU inventories, European gas prices have increased by 32.5% to around 49.3 EUR/MWh since the September Governing Council meeting. The recent increases in gas prices were driven by growing supply concerns following the closure of an Israeli gas facility, the shutdown of the gas pipeline between Estonia and Finland and the threat of strike action at two liquefied natural gas plants in Australia. While oil and gas futures curves suggest lower prices in the medium term, short-term upside risks remain, reflecting heightened uncertainty over supply conditions.
Non-energy commodity prices decreased slightly. Since the September meeting of the Governing Council, metal prices have declined by 3.6% amid a potential deterioration in the global economic outlook and headwinds to growth in China. Food commodity prices have remained broadly unchanged (+0.25%) amid some heterogeneity in grain food items, with lower wheat prices from increased US wheat supply being offset by higher corn prices.
Chart 3
Commodity price developments
(left-hand scale: USD/barrel (oil), index: 2020 = 100 (all commodities excluding energy); right-hand scale: EUR/MWh (gas))

Sources: Refinitiv, HWWI and ECB calculations.
Notes: Gas refers to the Dutch TTF gas price. The vertical line marks the date of the Governing Council meeting in September 2023. The latest observations are for 25 October 2023 for oil and gas and 20 October 2023 for commodities excluding energy.
In the United States, economic growth remained robust in the first half of 2023, but activity is expected to decelerate towards the end of the year. Real GDP growth surprised to the upside in the second quarter, but some leading indicators, including credit card spending data, signal weaker consumer spending in the third quarter. In the first half of the year spending was supported by households drawing down their excess savings, but this support will be more limited going forward as these excess funds have been largely depleted. Meanwhile, the labour market continues to ease, but remains tight. The vacancy/unemployed ratio, a measure of labour market tightness, is gradually falling but remains well above historical levels, particularly in the services sector. Headline consumer price index (CPI) inflation remained at 3.7% in September, unchanged from August. Core inflation continued to decline in September, by 0.2 percentage points to 4.1%, with core goods prices also declining in month-on-month terms. By contrast, service prices are accelerating.
The slowdown of the Chinese economy seems to be moderating. Following the strong deceleration of Chinese economic activity in the second quarter, owing to a sharp decline in the housing sector, recent activity indicators show signs of stabilising. In September retail sales growth increased further to 5.5% year on year, from 4.6% the previous month, while industrial production growth stabilised at a year-on-year rate of 4.5%. Accordingly, GDP growth for the third quarter was stronger than expected at 1.3% quarter on quarter, up from a downward-revised rate of 0.5% in the second quarter. In addition, activity data for September point to a two-speed economy in terms of growth drivers: while the contraction in property investment continued to intensify in the third quarter, activity outside the real estate sector remained more robust. Broader consumption spending and the manufacturing sector continue to support growth, for example in the automobile sector. Meanwhile, targeted government measures, which are mainly aimed at supporting housing activity, provide some limited support to the economy. CPI inflation turned positive in August, largely owing to energy price developments. Overall, CPI inflation appears to have bottomed out but is likely to remain subdued amid weak domestic and external demand.
In Japan, economic growth is set to moderate in the third quarter. The latest PMI indicators signal some loss of momentum in the services sector, which is likely to exacerbate the persistent softness in manufacturing activity. These indicators suggest that the divergence between sectors is narrowing. Domestic demand is expected to recover moderately from the weakness observed in the previous quarter, with August data signalling a limited recovery in private consumption levels thus far. By contrast, the recovery in exports appears to have stalled. Headline inflation slowed marginally to 3.2% in August, while core inflation remained unchanged at 2.7%, reflecting both higher accommodation charges and lower household durable goods inflation. Overall, inflation indicators continue to signal a firm underlying price momentum, also reflecting robust wage growth. Nevertheless, annual headline inflation rates are expected to ease somewhat, in line with declining imported cost pressures.
The outlook for the UK economy is weak. Monthly real GDP increased by 0.2% in August, following a 0.6% decline in July, while the latest PMI indicators point to continued weak economic growth. However, business confidence has remained robust and consumer confidence has continued to improve. Consumers continue to benefit from the still solid labour market, while falling inflation is supporting real incomes. Overall, GDP is expected to stagnate in the second half of the year, but a recession should be avoided. Private consumption will continue to be supported by declining inflation and strong wage growth, which underpin real incomes, but high mortgage rates and tight financial conditions will increasingly act as a drag on domestic demand.
2 Economic activity
The euro area economy remains weak. Recent information suggests that manufacturing output has continued to fall. Subdued foreign demand and tighter financing conditions are increasingly weighing on investment and consumer spending. The services sector is also weakening further. This is mainly because weaker industrial activity is spilling over to other sectors, the impetus from reopening effects is fading and the impact of higher interest rates is broadening. The economy is likely to remain weak for the remainder of this year. However, as inflation falls further, household real incomes recover and the demand for euro area exports picks up, the economy should strengthen over the coming years. Economic activity has so far been supported by the strength of the labour market, although there are signs that the labour market is weakening.
Euro area real GDP growth is expected to have weakened in the third quarter of 2023. Following broadly flat growth at the turn of the year and further into the first quarter, euro area GDP edged up by 0.2% in the second quarter (Chart 4). Changes in inventories were the main driver of this growth, while domestic demand contributed only slightly and net trade had a strong negative impact. Incoming data for the third quarter point to continued weak output growth.[1] In July and August, euro area industrial production declined by 1.0% compared with its second-quarter level, largely driven by lower production in the capital goods sector. However, services production rose by 0.3% month on month in July, indicating that the services sector was still holding up relative to manufacturing. More timely survey data for the whole of the third quarter corroborate the picture of slow growth – or even falling output – in that period. The composite output Purchasing Managers’ Index (PMI) for the euro area entered contractionary territory in the third quarter, reflecting a decline in the PMI for both manufacturing and services. Business expectations and new orders, at already low levels, deteriorated further, signalling bleak prospects for the industrial sector in the period ahead (Chart 5, panel a). The PMI for services business activity moved below the growth threshold of 50 in the third quarter, hinting at falling activity (Chart 5, panel b). Similar to the slowdown observed in industrial activity, new orders and business expectations also declined.[2]
Chart 4
Euro area real GDP, composite output PMI and ESI
(left-hand scale: quarter-on-quarter percentage changes; right-hand scale: diffusion index)
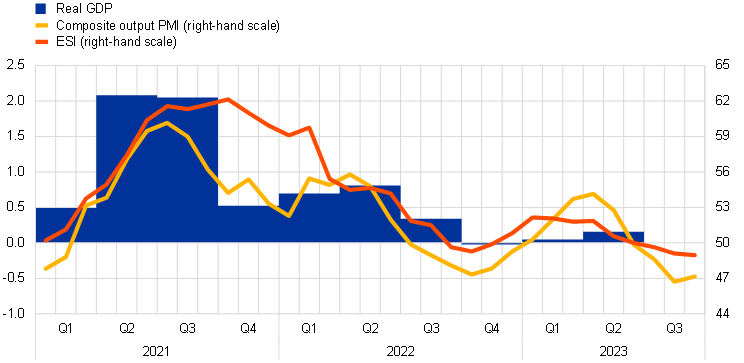
Sources: Eurostat, European Commission, S&P Global Market Intelligence and ECB calculations.
Notes: The two lines indicate monthly developments; the bars show quarterly data. The European Commission’s Economic Sentiment Indicator (ESI) has been standardised and rescaled to have the same mean and standard deviation as the composite output Purchasing Managers’ Index (PMI). The latest observations are for the second quarter of 2023 for real GDP, September 2023 for the ESI and October 2023 for the composite output PMI.
Chart 5
Production and PMI indicators across sectors of the economy
(index: 2015 = 100, diffusion index)
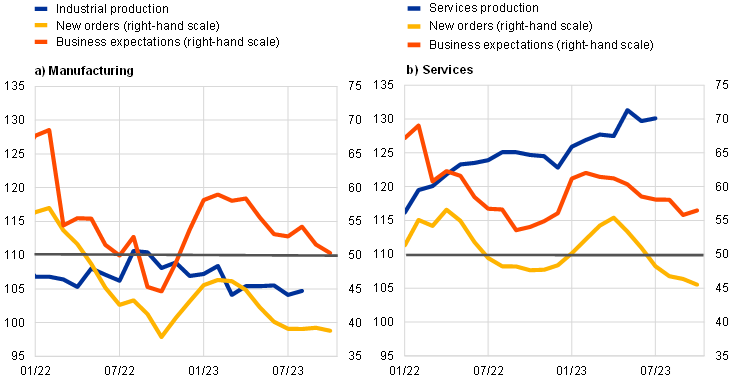
Sources: Eurostat and S&P Global Market Intelligence.
Note: The latest observations are for July 2023 for services production, August 2023 for industrial production and October 2023 for the Purchasing Managers’ Indices.
Euro area output is expected to show continued weakness in the final quarter of the year. The findings from the contacts held by ECB staff in October with companies operating in the non-financial sector suggest that activity is set to remain weak in the final quarter of the year (Box 6). PMI data for October also show that the manufacturing sector is continuing its contractionary path into the fourth quarter on the back of the growing impact of weak global trade and of strong monetary policy transmission. New orders and business expectations also declined in October for the manufacturing sector. The picture is broadly similar for the services sector, with most PMI indicators pointing to a further slowdown in the fourth quarter.
The labour market remains resilient, although more recent indicators suggest signs of cooling following weaker economic activity. Employment growth continued to be robust in the first half of the year, at an average quarterly rate of 0.3%. The unemployment rate decreased to 6.4% in August (Chart 6). These dynamics were supported by an increase in the labour force that was broad-based across demographic groups. The increase in the labour force was particularly strong for older workers and those with high levels of education, although it should also be noted that the participation rate of workers with low levels of education has increased in recent quarters (and also compared with past trends). The large number of people employed in the first half of 2023 masked ongoing suppressed working hours as a result of continued high levels of sick leave and some labour hoarding. In the second half of the year, weaker economic activity is likely to translate into weaker labour market momentum. The unemployment expectations of professional forecasters edged upwards, pointing to the likelihood of an increase in the unemployment rate over the coming year.
Chart 6
Euro area employment, the PMI assessment of employment and the unemployment rate
(left-hand scale: quarter-on-quarter percentage changes, diffusion index; right-hand scale: percentages of the labour force)
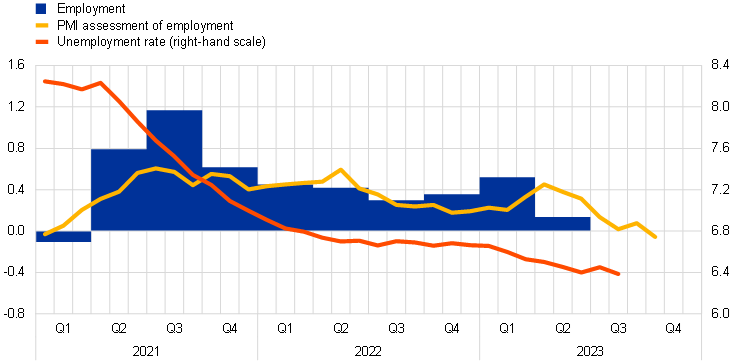
Sources: Eurostat, S&P Global Market Intelligence and ECB calculations.
Notes: The two lines indicate monthly developments; the bars show quarterly data. The Purchasing Managers’ Index (PMI) is expressed in terms of the deviation from 50 divided by 10. The latest observations are for the second quarter of 2023 for employment, October 2023 for the PMI assessment of employment and August 2023 for the unemployment rate.
The PMI employment indicator for the whole economy suggests a slowdown in employment dynamics in the second half of the year. The overall PMI indicator stood at 49.4 in October, pointing to a decline in employment for the first time since January 2021. The PMI employment indicator for the manufacturing and construction sectors remained in contractionary territory. For the services sectors, the indicator stood at 50.5 in October, pointing to fewer new jobs being created in these sectors, which, over the past year, have been a major driver of employment growth.
Private consumption is expected to have remained sluggish in the third quarter reflecting a further contraction in spending on goods. In July and August retail sales were, on average, 0.6% lower than their level for the second quarter. At the same time, new passenger car registrations recovered in the third quarter – boosted by sales of electric cars, whose market share exceeded 20% for the first time – mostly reflecting delayed past orders. On the services side, incoming soft data support a stronger outlook for contact-intensive services than for consumer spending on goods, especially in the short term. The European Commission’s indicator for consumer confidence declined slightly in October after falling in August and September, remaining well below its long-term average. Expected demand for contact-intensive services had not seen any strong downward correction since May 2023. According to the European Commission’s consumer and business survey for September, demand for contact-intensive services remained above its historical average in that month (Chart 7, panel a). By contrast, expected major purchases deteriorated further and, in line with retail trade business expectations, remain below their long-term average levels. The transmission of tighter financing conditions to the real economy is likely to curb household borrowing, keep households’ incentives to save high and continue to subdue consumer spending growth in the near term. The ECB’s August Consumer Expectations Survey (CES) shows that consumers expect mortgage interest rates to continue to increase and the share of respondents expecting credit to become harder to obtain remains elevated (Chart 7, panel b).
Chart 7
Expected manufacturing production, expected services demand and households’ expectations regarding access to credit
(percentage balances, percentages)

Sources: European Commission and the ECB’s Consumer Expectations Survey.
Notes: The latest observations are for September 2023 in panel a) and for August 2023 in panel b). Credit access denotes the share of respondents that expect tighter credit conditions.
Business investment is expected to have weakened further in the third quarter, with activity dampened by a lack of demand and tighter financing conditions. Quarter-on-quarter headline non-construction investment grew by 0.7% in the second quarter of 2023, but this would have been 0.4% had the volatile data on intangible investment in Ireland been excluded. Available short-term and survey data point to further weakening in the third quarter, as capital goods production declined in July and August compared with the second quarter. The PMI output, new orders and outstanding business indicators for the capital goods sector continued to decline in the third quarter, to levels below those seen in the previous quarter (Chart 8, panel a). Although manufacturing confidence in the capital goods sector and the PMI new order assessment both improved somewhat in September, they remained in contractionary territory as business investment was constrained by a lack of demand and tighter financing conditions. The October 2023 euro area bank lending survey indicates that demand from firms for loans for fixed investment in the third quarter remained highly subdued. In addition, contacts held by ECB staff in October with companies operating in the non-financial sector suggest that higher interest rates are causing capital investment to be partly postponed, which could lead to lower annual investment in the coming years. Capital and intermediate goods producers also reported that costlier finance was leading to low demand and therefore less need to maintain or extend capacity. In the medium term, investment in sectors such as transportation, electricity, gas and air conditioning, in addition to education, should benefit from longer-term plans for digital and green investments, including measures to improve energy efficiency. These types of investment will also be supported by Next Generation EU funds.
Chart 8
Business and housing investment and short-term indicators
(quarter-on-quarter percentage changes, deviations from the mean)
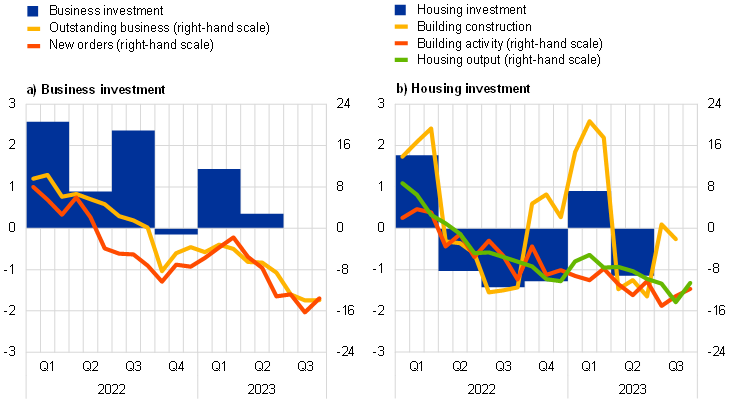
Sources: Eurostat, European Commission, S&P Global Market Intelligence and ECB calculations.
Notes: Business investment is proxied by non-construction investment and excludes Irish intellectual property products. Business investment, PMI outstanding business and PMI new orders (European Commission’s business confidence survey) for capital goods are expressed as deviations from 50 (1985-2019 average). The latest observations are for the second quarter of 2023 for investment and September 2023 for the other variables. The index for building construction production is computed as the percentage change over the average level in the previous quarter. The European Commission’s index for building construction activity over the past three months is calculated as the change from the average level in the fourth quarter of 2021. The Purchasing Managers’ Index (PMI) for housing (i.e. residential construction) output is expressed as deviations from 50. The latest observations are for the second quarter of 2023 for investment, August for building construction production and September 2023 for the other variables.
Housing investment is expected to have declined in the third quarter, amid anaemic demand and tight financing conditions. This decline amplifies a cumulative loss in housing investment of around 4% between the first quarter of 2022 and the second quarter of 2023 and has been confirmed by both hard and soft indicators. With regard to hard indicators, the number of residential building permits issued – a leading indicator of construction activity – has fallen considerably over the past year, reaching an eight-year low in June 2023 (disregarding the pandemic lockdowns of April and May 2020). In addition, the number of new construction companies registered in July and August stood, on average, below the level seen in the second quarter of 2023. Building construction output in July and August fell 0.3% short of its average in the second quarter. With regard to soft indicators, the PMI for residential construction output sank deeper into contractionary territory in the third quarter (Chart 8, panel b). The European Commission’s index for building construction activity in the past three months recorded its sixth consecutive decline in the third quarter. This reflected lower demand and tight financial conditions, despite some relief offered by the easing of materials shortages. Looking ahead, ECB surveys suggest subdued activity in the fourth quarter, with rising mortgage rates and elevated construction costs weighing on housing affordability and profitability respectively. According to the CES, households’ perception of housing as a good investment bottomed out in January, but it was still downbeat in September. In addition, in the contacts held by ECB staff in October with companies operating in the non-financial sector, construction companies reported declining activity and orders owing to elevated cost pressures and rising interest rates.
Euro area export volumes are expected to grow at a subdued pace in the third quarter as a result of weak global demand. The growth momentum for extra-euro area goods exports (based on three-month-on-three-month growth rates) declined in August as weak global trade dampened demand for euro area goods and persistently high energy prices weighed on competitiveness. The euro’s depreciation since July will help to ease competitive pressures but the boost to competitiveness is unlikely to be broad-based. While, on aggregate, firms’ unfulfilled orders had already returned to pre-pandemic levels by the summer, some heterogeneity among sectors persists. In several major sectors – motor vehicle, data processing (computers), machinery and electrical equipment – many firms are still reporting supply shortages, suggesting that they are still feeling the impact of past supply shocks. The unwinding of these shocks should bolster export performance. The growth momentum for import volumes declined further in August, reflecting weak domestic demand and low inventories. Forward-looking indicators continue to point to a subdued near-term outlook for euro area export volumes, while survey data for September show that new export orders for goods and services remain in contractionary territory.
Beyond the near term, GDP growth is expected to gradually strengthen. The economy is likely to remain weak for the remainder of this year. However, as inflation falls further, household real incomes recover and the demand for euro area exports picks up, the economy should strengthen over the coming years.
3 Prices and costs
According to the latest figures from Eurostat, inflation decreased from 5.2% in August to 4.3% in September 2023.[3] The decline was broad-based. Inflation is likely to come down further in the near term as the sharp price increases in energy and food recorded in autumn 2022 drop out of the yearly rates. At the same time, energy price developments have become more uncertain in view of the new geopolitical tensions. Inflation excluding energy and food dropped from 5.3% in August to 4.5% in September, supported by improving supply conditions, the pass-through of previous declines in energy prices, and the impact of tighter monetary policy on demand and corporate pricing power. Most measures of underlying inflation have continued to decline, but domestic price pressures are still strong, reflecting also the growing importance of rising wages. Measures of longer-term inflation expectations mostly stand around 2% but some indicators remain elevated and need to be monitored closely.
The headline inflation rate in the euro area, as measured by the Harmonised Index of Consumer Prices (HICP), was 4.3% in September (Chart 9). The drop from 5.2% in August reflects declines in all the main components, partly due to base effects in individual subcomponents, as strong month-on-month dynamics in September 2022 dropped out of the annual rate calculation. The base effects concern energy and food, but also components of core inflation.
Chart 9
Headline inflation and its main components
(annual percentage changes; percentage point contributions)
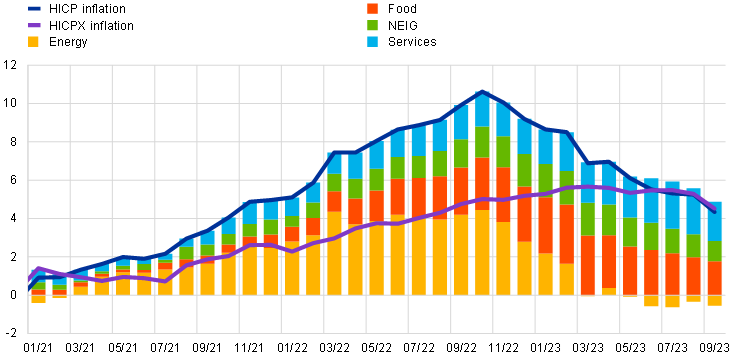
Sources: Eurostat and ECB calculations.
Notes: NEIG stands for non-energy industrial goods. The latest observations are for September 2023.
Energy inflation remained negative in September, mainly due to downward base effects (Chart 10). The main driver of the more negative annual rate of change (-4.6% after -3.3% in August) was the price of gas (measured in terms of the HICP gas price index), which continued to edge downwards and was 26.6% lower than at its peak in October 2022. The annual growth rate of electricity prices remained negative, unlike fuel prices, which returned to a positive annual growth rate after surging in recent months. Pipeline pressures for energy prices continued to recede, with annual growth in energy producer prices falling to -30.7% in August 2023, down from a peak of 117.3% in the same month of the previous year.
Food inflation declined again, falling from 9.7% in August to 8.8% in September, but remained elevated owing to remaining effects of past shocks (Chart 10). This decrease was driven by slower dynamics in both unprocessed and processed food prices. Processed food price inflation fell from 10.3% in August to 9.4%, while unprocessed food price inflation dropped from 7.8% to 6.6%. The month-on-month changes for unprocessed food are in line with historical average rates for September, while the decrease in processed food was smaller than usual for that month. As the impacts of earlier cost pressures arising from energy and food input prices keep fading, food inflation should continue to moderate.
HICP inflation excluding energy and food (HICPX) decreased from 5.3% in August to 4.5% in September. In terms of components, non-energy industrial goods (NEIG) inflation declined from 4.7% to 4.1%, reflecting the gradually fading impact of past shocks. Services inflation declined from 5.5% in August to 4.7% in September, but this decrease can be partly attributed to the base effects observed due to the rebound in transport prices last year after the subsidised public transport ticket in Germany was discontinued. At the same time, a slowdown in price developments of some contact-intensive services, such as restaurants and accommodation, has also contributed to the decline in services inflation.
Chart 10
Energy and food input costs, and HICP food prices
(annual percentage changes)

Source: Eurostat.
Note: The latest observations are for August 2023 for the producer price indices and September 2023 for euro area farm gate prices and HICP food.
Inflationary pressures continued to decline throughout the pricing chain (Chart 11). At the early stages, producer price inflation for domestic sales of intermediate goods remained negative in August (-4.5% after -4.0% in July), and the same holds more strongly for import price inflation for intermediate goods (-9.1% after -9.2% in July). At the later stages, producer price inflation for non-food consumer goods decreased further, from 5% in July to 4.7% in August, and the corresponding import price inflation fell from -0.3% to -0.6%. A similar moderation of producer price and import price dynamics was observed for manufactured food. This confirms the gradual easing of pipeline pressures for consumer prices of both NEIG and processed food items. The strengthening of the euro over recent months continues to affect the magnitude and movement of import price dynamics, in turn contributing to the easing of price pressures.
Chart 11
Indicators of pipeline pressures
(annual percentage changes)

Sources: Eurostat and ECB calculations.
Note: The latest observations are for August 2023.
Most indicators of underlying inflation in the euro area continued to decline, reflecting the diminishing impact of earlier shocks as well as tightened monetary policy (Chart 12). A number of indicators seem to have peaked. The Persistent and Common Component of Inflation (PCCI) measure has plateaued since July, at 2.6%. HICPX decreased from 5.3% in August to 4.5% in September and HICPXX (HICP excluding energy, food, travel-related items, clothing and footwear) also continued to fall, from 4.9% in August to 4.3% in September. The relatively strong declines in these two indicators partly reflect base effects related to transport services prices. The Supercore indicator, which includes cyclically sensitive HICP items, continued to decrease steadily, from 5.5% in August to 5.2% in September. With wage pressures becoming more significant, the domestic inflation rate remained high, but also moderated from 5.4% in August to 5.2% in September. All in all, while the decline in underlying inflation indicators reflects the diminishing impact of earlier shocks, it can increasingly also be attributed to the tightening of monetary policy. Nonetheless, strong domestic price pressures highlight the growing importance of rising wages.
Chart 12
Indicators of underlying inflation
(annual percentage changes)

Sources: Eurostat and ECB calculations.
Notes: The range of indicators of underlying inflation includes HICP excluding energy, HICP excluding energy and unprocessed food, HICPX, HICPXX, 10% and 30% trimmed means, PCCI and a weighted median. The grey dashed line represents the ECB’s inflation target of 2% over the medium term. The latest observations are for September 2023.
Wage growth remained strong, especially in the services sector, although the labour market shows signs of cooling. The latest available data show that the annual growth rate of negotiated wages remained unchanged at 4.4% in the second quarter of 2023. However, forward-looking wage trackers continue to signal that wage pressures will remain high for the remainder of the year. Actual wage growth, as measured by compensation per employee and compensation per hour, increased in the second quarter of 2023 to 5.6% and 5.4% respectively, up from 5.5% and 4.8% in the first quarter. The contribution of unit profits to domestic price pressures, as measured by the annual growth rate of the GDP deflator, weakened in the second quarter of 2023 from a historical high in the first quarter.
Most survey-based indicators of longer-term inflation expectations in the euro area remained more or less unchanged at around 2%, while market-based measures of inflation compensation declined slightly from the elevated levels observed over the summer (Chart 13). The ECB Survey of Professional Forecasters (SPF) for the fourth quarter of 2023 sees average and median longer-term inflation expectations (for 2028) unchanged at 2.1% and 2.0% respectively. Longer-term inflation expectations also stood at 2.1% in the October 2023 Consensus Economics survey. The median longer-term expectations remained unchanged at 2.0% in the October 2023 ECB Survey of Monetary Analysts (SMA). In the ECB Consumer Expectations Survey (CES) for August 2023, median expectations over the next year increased from 3.4% in July to 3.5% in August, while those for three years ahead rose to 2.5%, up from 2.4%.[4] These higher inflation expectations coincide with very recent increases in fuel prices. Euro area market-based measures of inflation compensation (based on HICP excluding tobacco) decreased marginally across the term structure over the review period. At the short end, the one-year forward inflation-linked swap (ILS) rate one year ahead stood at around 2.5% in late October, down by 15 basis points from the start of the review period. This is mainly due to decreasing inflation risk premia, as the euro area five-year forward ILS rate five years ahead declined by around 10 basis points to roughly 2.5%, even as comparable measures increased in the United States.
Chart 13
Headline inflation, inflation projections and expectations.
a) Headline inflation, survey-based indicators of inflation expectations, inflation projections and market-based measures of inflation compensation
(annual percentage changes)
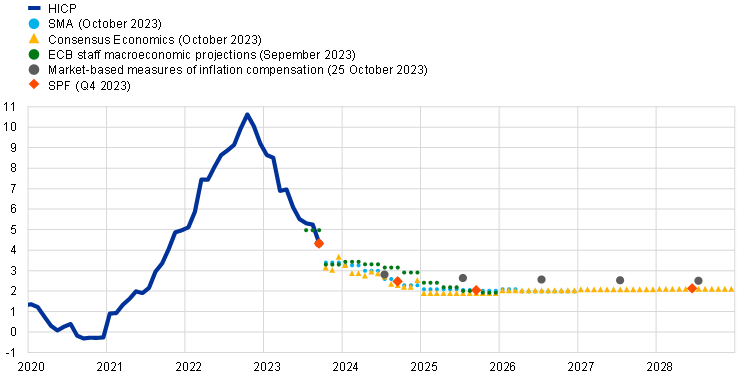
b) Headline inflation and ECB Consumer Expectations Survey
(annual percentage changes)
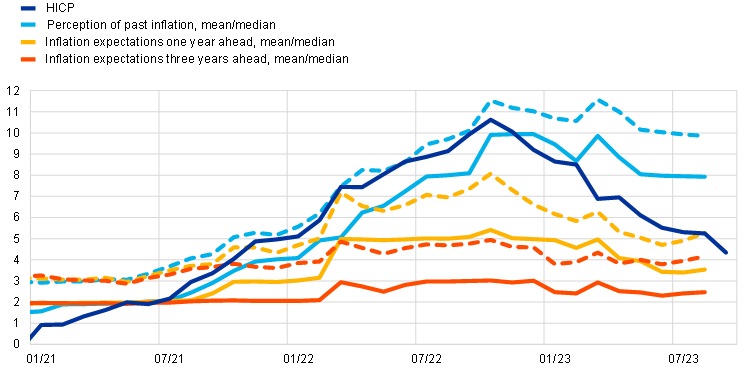
Sources: Eurostat, Refinitiv, Consensus Economics, CES, SPF, SMA, ECB staff macroeconomic projections for the euro area, September 2023, and ECB calculations.
Notes: The market-based measures of inflation compensation series is based on the one-year spot inflation rate, the one-year forward rate one year ahead, the one-year forward rate two years ahead and the one-year forward rate three years ahead. The observations for market-based measures of inflation compensation are for 25 October 2023. The SPF for the fourth quarter of 2023 was conducted between 29 September and 5 October 2023. The cut-off date for the Consensus Economics long-term forecasts was October 2023. For the CES, dashed lines represent the mean and solid lines the median. The cut-off date for data included in the ECB staff macroeconomic projections was 22 August 2023. The latest observations are for September 2023 for HICP and August 2023 for CES.
4 Financial market developments
Over the review period (14 September to 25 October 2023), developments in the euro area financial markets reflected expectations for a stable near-term policy rate path, while longer-term rates increased. Following the Governing Council’s monetary policy decision in September to raise the three key ECB interest rates by 25 basis points, the short end of the euro area risk-free curve varied only marginally, reflecting expectations of market participants that policy rates have reached their peak, while euro area longer-term risk-free rates stood noticeably higher than at the time of the September meeting, largely reflecting spillovers from the US market. Sovereign bond yields in the euro area increased in line with risk-free rates, with some widening of spreads recorded for Italian government bond yields. Weighed down by increases in longer-term discount rates, equity prices declined particularly for non-financial corporations, while euro area corporate bond spreads widened somewhat, especially for the high-yield segment. In foreign exchange markets, the euro depreciated in trade-weighted terms. The escalation of tensions in the Middle East since early October, while leading to increased market volatility, had a limited impact overall on the euro area financial markets.
Euro area near-term risk-free rates ended the review period broadly in line with the levels prevailing around the time of the September Governing Council meeting, while longer-term risk-free rates stood noticeably higher. The euro short-term rate (€STR) averaged 387 basis points over the review period. The overnight index swap (OIS) forward curve, which is based on the benchmark €STR, remained broadly stable for short-term maturities after the Governing Council’s monetary policy decision in September to raise the three key ECB interest rates by 25 basis points. Over the review period as a whole, near-term forward rates fluctuated within a narrow range. The priced probability of a further rate hike thus continues to be close to zero, reflecting market participants’ expectations that policy rates have reached their peak. The curve currently suggests that a first 25 basis point cut is priced in for mid-2024, with an additional two 25 basis point cuts priced in by the end of 2024. While near-term risk-free rates showed little change, euro area longer-term risk-free rates stood higher than at the time of the September meeting, reflecting spillovers from the US market, albeit with some downward pressure following the escalation of tensions in the Middle East in early October. The euro area ten-year nominal risk-free rate, for instance, peaked at 3.3% in early October before slowing down to around 3.2%, ending the review period with an overall increase of around 28 basis points.
Long-term sovereign bond yields moved broadly in line with risk-free rates amid overall stable sovereign spreads (Chart 14). On 25 October the euro area GDP-weighted average ten-year sovereign bond yield stood at around 3.5%, about 25 basis points above its level at the beginning of the review period. Ten-year sovereign bond yields in the euro area moved broadly in line with long-term risk-free rates. Sovereign spread movements were very contained throughout the review period, with the exception of the Italian spread, which widened somewhat, likely reflecting idiosyncratic factors related, inter alia, to domestic fiscal budget news. The increase in euro area long-term rates followed similar dynamics globally; the ten-year US sovereign bond yield increased by 41 basis points to stand at 4.7%, and the UK sovereign bond yield increased by 20 basis points to 4.5%.
Chart 14
Ten-year sovereign bond yields and the ten-year OIS rate based on the €STR
(percentages per annum)

Sources: Refinitiv and ECB calculations.
Notes: The vertical grey line denotes the start of the review period on 14 September 2023. The latest observations are for 25 October 2023.
Corporate bond spreads widened somewhat over the review period, with increases most pronounced in the high-yield segment. The spread increase was modest for investment-grade firms, while the widening of spreads was more pronounced for speculative-grade firms, at over 60 basis points, reflecting higher expected default risks and heightened investor risk aversion.
Euro area equity prices declined over the review period, weighed down by increases in longer-term discount rates and the recent intensification of geopolitical risks. Broad stock market indices in both the euro area and the United States fell by more than 6% over the review period amid higher discount rates. Equity price losses in the euro area were relatively broad-based across sectors, with interest rate-sensitive sectors, such as utilities and telecommunications, underperforming, while the financial sector outperformed the broad index. Overall, the equity prices of euro area non-financial corporations decreased by around 6.8%, while euro area banks’ equity prices saw a smaller decrease of 3.7% over the review period. In the United States, equity prices declined by around 7% for non-financial corporations and by as much as 9.5% for banks. The escalation of tensions in the Middle East since early October is likely to have weighed on general risk sentiment and stock market volatility, albeit so far with a contained impact overall, as the initial equity price losses broadly retraced thereafter.
In foreign exchange markets, the euro depreciated in trade-weighted terms (Chart 15). During the review period, the nominal effective exchange rate of the euro – as measured against the currencies of 41 of the euro area’s most important trading partners – depreciated by 0.4%. In terms of bilateral exchange rate movements against major currencies, the euro depreciated against the US dollar (by 1.4%), as well as against the Chinese renminbi (by 0.9%) and the Swiss franc (by 1.2%), while it also weakened against the currencies of some non-euro area EU Member States (by 3.1% against the Polish zloty and 1.5% against the Swedish krona). The euro appreciated against the pound sterling (by 1.4%), the Japanese yen (by 0.3%), the Turkish lira (by 2.8%) and the Indian rupee (by 1.9%).
Chart 15
Changes in the exchange rate of the euro vis-à-vis selected currencies
(percentage changes)

Source: ECB.
Notes: EER-41 is the nominal effective exchange rate of the euro against the currencies of 41 of the euro area’s most important trading partners. A positive (negative) change corresponds to an appreciation (depreciation) of the euro. All changes have been calculated using the foreign exchange rates prevailing on 25 October 2023.
5 Financing conditions and credit developments
The transmission of the ECB’s monetary policy tightening to broader financing conditions has remained strong. Bank funding costs and bank lending rates increased further, reaching their highest levels since 2008 for firms and since mid-2011 for households for house purchase. Over the period from 14 September to 25 October 2023, the significant increase in long-term risk-free rates drove the noticeable rise in the cost to non-financial corporations (NFCs) of both market-based debt and equity financing. The most recent euro area bank lending survey indicates that, in the third quarter of 2023, banks further tightened their credit standards for all loan categories and loan demand from firms and households once again decreased substantially. Weakness in bank lending to firms and households continued in August and September amid higher lending rates, lower loan demand and tighter credit standards. Annual money growth declined further, driven by high opportunity costs, subdued credit growth and the reduction in the Eurosystem balance sheet.
Euro area bank funding costs continued to rise, amid further increases in deposit rates and bank bond yields. The composite cost of debt financing for euro area banks increased moderately in August and reached its highest level in more than ten years, with rising heterogeneity across countries (Chart 16, panel a). In the same month, bond yields decreased slightly, but this was more than offset by further increases in September and October following developments in sovereign bond yields (Chart 16, panel b).[5] Deposit rates continued to rise steadily, with some variation across instruments and sectors. The rates offered to firms remained higher than those to households, though the latter increased more steeply in August. The spread between time and overnight deposit rates continued to widen, reflecting the increase in money market rates that incentivised depositors to shift large volumes of their overnight holdings to time deposits and other instruments with higher remuneration. At the same time, the pass-through from policy to deposit rates has continued to vary significantly across countries and banks, mainly reflecting differences in competition, liquidity needs and regulatory arrangements.
The ongoing phasing-out of targeted longer-term refinancing operations (TLTROs) contributed to a reduction in excess liquidity in an environment of still ample system-wide liquidity. The overall outstanding amount of TLTRO III funds decreased by €1.622 trillion, down to €491 billion, following the settlement on 27 September 2023. This is 77% below the amount outstanding before the October 2022 recalibration of the TLTRO III remuneration (€2.113 trillion).[6] To make up for the lower liquidity provided by the ECB, banks have increased their issuance of debt securities and money market instruments and competed more actively with each other for deposits by increasing the remuneration on these instruments. Savers have moved deposits from banks offering less attractive remuneration to those that have raised their deposit rates at a faster pace. Issuance of bank bonds, which are more expensive for banks than deposits and TLTROs, has increased in volume since September 2022, amid the winding-down of TLTROs and the decline in overnight deposits.
Chart 16
Composite bank funding costs in selected euro area countries
(annual percentages)
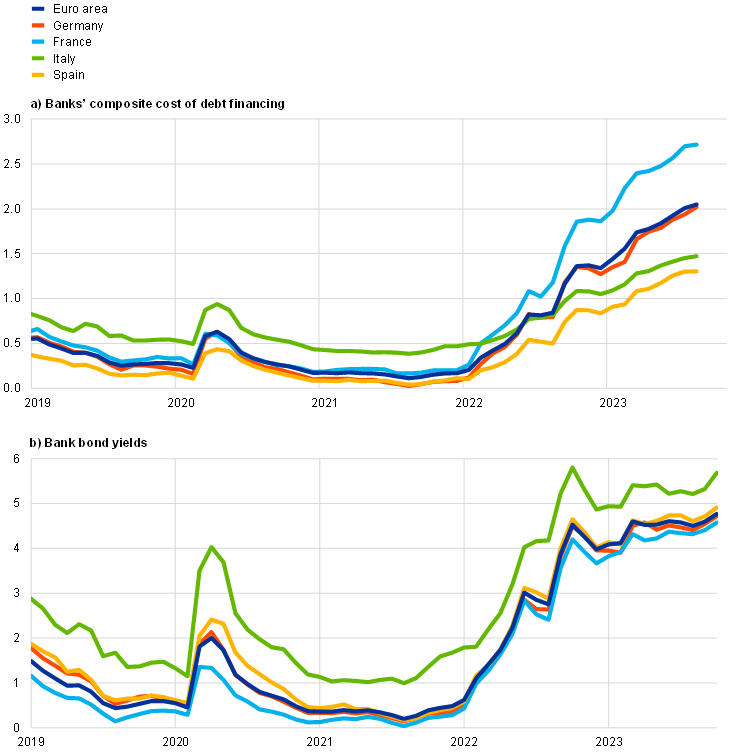
Sources: ECB, S&P Dow Jones Indices LLC and/or its affiliates, and ECB calculations.
Notes: Composite bank funding costs are a weighted average of the composite cost of deposits and unsecured market-based debt financing. The composite cost of deposits is calculated as an average of new business rates on overnight deposits, deposits with an agreed maturity and deposits redeemable at notice, weighted by their respective outstanding amounts. Bank bond yields are monthly averages for senior-tranche bonds. The latest observations are for August 2023 for banks’ composite cost of debt financing and 25 October 2023 for bank bond yields.
In August, lending rates for firms and households increased further, reflecting higher ECB policy rates and tighter credit standards. ECB policy rates have risen substantially and rapidly, namely by a total of 450 basis points between early July 2022 and September 2023. This has led to lending rates increasing sharply across euro area countries for both firms and households (Chart 17). Bank rates on new loans to NFCs have reached their highest level since the end of 2008, although the increase in August was more contained than in previous months, amid decreasing loan origination and tightening credit standards. Lending rates for firms rose to 4.99%, compared with 4.94% in July 2023 and 1.55% in May 2022 – before the ECB signalled the first rate hike in the current cycle. Loans with an interest rate fixation period of less than one year accounted for the largest increases, while those with longer fixation periods saw rates decline in August, amid an inversion of the yield curve. Bank rates on new loans to households for consumption and other lending also rose further, standing at 7.25% in August – their highest level since late 2008 – compared with 7.07% in July 2023 and 4.68% in May 2022. Lending rates for new loans to households for house purchase also continued to increase, standing at 3.85% in August – their highest level since mid-2011 – compared with 3.76% in July 2023 and 1.78% in May 2022. The rise in August was widespread across countries and stronger for flexible-rate mortgages than for fixed-rate contracts. The results of the August 2023 ECB Consumer Expectations Survey suggest that consumers expect mortgage rates to stabilise somewhat above the current levels over the next 12 months, possibly reflecting the advanced stage of the tightening cycle. A large net percentage of survey respondents perceived credit standards to be tight and expected housing loans to become harder to obtain over that same period. The cross-country dispersion of lending rates remained at a low level for both firms and households (Chart 17, panels a and b).
Chart 17
Composite bank lending rates for NFCs and households in selected countries
(annual percentages; standard deviation)
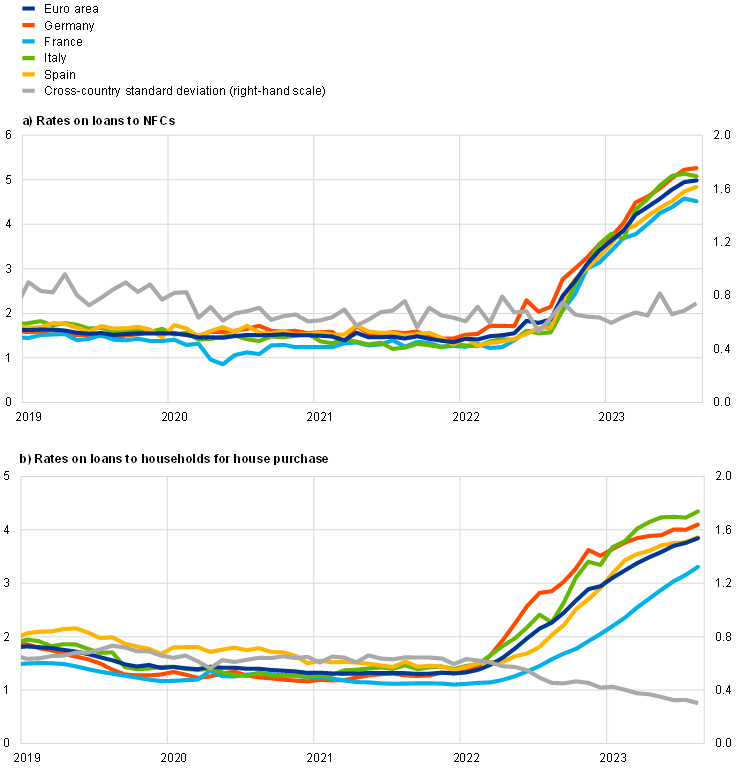
Source: ECB.
Notes: Composite bank lending rates for non-financial corporations (NFCs) are calculated by aggregating short and long-term rates using a 24-month moving average of new business volumes. The cross-country standard deviation is calculated using a fixed sample of 12 euro area countries. The latest observations are for August 2023.
From 14 September to 25 October 2023 the cost to NFCs of both market-based debt and equity financing increased significantly. In August 2023 the overall cost of financing for NFCs – i.e. the composite cost of bank borrowing, market-based debt and equity – rose by 10 basis points compared with the previous month, to stand at 6.3% (Chart 18).[7] This was the result of an increase in the cost of equity and also, to a lesser extent, in both the cost of market-based debt – driven by a widening of bond spreads in both the investment-grade and high-yield segments – and the cost of short-term borrowing from banks. Over the same period the cost of long-term borrowing from banks decreased, thereby partially offsetting the increase in the other components of the cost of financing. As a result, the overall cost of financing in August remained close to the elevated levels that were reached in September 2022 and had previously been seen at the end of 2011. Over the review period the sharp increase in long-term risk-free rates was the main driver behind the noticeable rise in the cost of market-based debt. A further widening of the spreads on bonds issued by non-financial firms, which was most pronounced in the high-yield segment (see Section 4), contributed to the increase in the cost of market-based debt. The significant increase in the cost of equity at the same time was almost entirely attributable to the higher risk-free rate (approximated by the ten-year overnight index swap rate) and, to some extent the slight rise in the equity risk premium.
Chart 18
Nominal cost of external financing for euro area NFCs, broken down by component
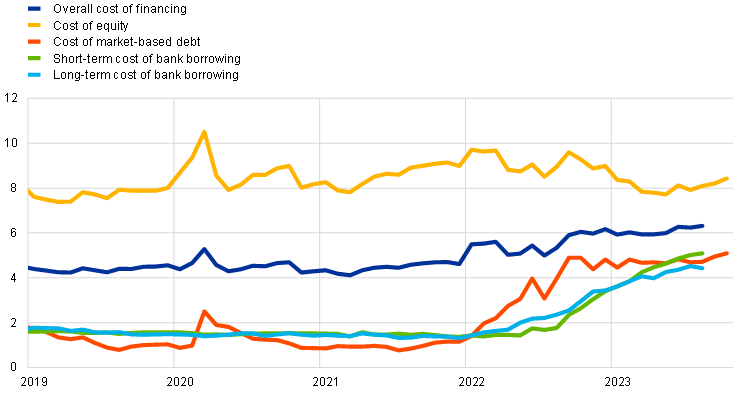
Sources: ECB and ECB estimates, Eurostat, Dealogic, Merrill Lynch, Bloomberg and Thomson Reuters.
Notes: The overall cost of financing for non-financial corporations (NFCs) is based on monthly data and is calculated as a weighted average of the cost of borrowing from banks (monthly average data), market-based debt, and equity (end-of-month data), based on their respective outstanding amounts. The latest observations are for 25 October 2023 for the cost of market-based debt and the cost of equity (daily data), and August 2023 for the overall cost of financing and the cost of borrowing from banks (monthly data).
According to the October 2023 euro area bank lending survey, credit standards for loans to firms tightened further in the third quarter of 2023 (Chart 19). The cumulative tightening since the beginning of 2022 has been substantial and is consistent with the ongoing marked weakening in lending dynamics. Risks related to firm-specific situations and the economic outlook remained the main drivers of the tightening of credit standards for firms, reflecting higher credit risks in the context of increasing debt servicing costs for firms and weak economic growth. Banks’ lower risk tolerance, higher bank funding costs and worsening bank balance-sheet situations also contributed to the tightening, which was driven mainly by lower liquidity positions. Euro area banks expect credit standards for loans to firms to tighten further in the fourth quarter of 2023, albeit at a moderating pace.
Chart 19
Changes in credit standards and net demand for loans to NFCs and loans to households for house purchase
(net percentages of banks reporting a tightening of credit standards or an increase in loan demand)
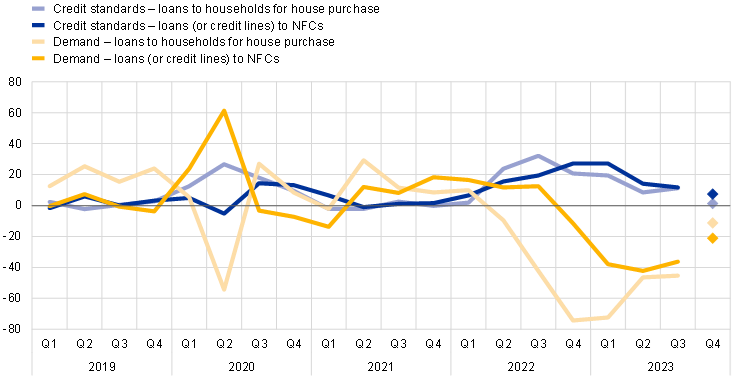
Source: Euro area bank lending survey.
Notes: NFC stands for “non-financial corporation”. For survey questions on credit standards, “net percentages” are defined as the difference between the sum of the percentages of banks responding “tightened considerably” and “tightened somewhat” and the sum of the percentages of banks responding “eased somewhat” and “eased considerably”. For survey questions on demand for loans, “net percentages” are defined as the difference between the sum of the percentages of banks responding “increased considerably” and “increased somewhat” and the sum of the percentages of banks responding “decreased somewhat” and “decreased considerably”. The diamonds denote expectations reported by banks in the current survey round. The latest observations are for the third quarter of 2023.
Banks reported a further net tightening of credit standards for loans to households in the third quarter of 2023, which greatly exceeded their previous expectations. For housing loans, the pace of net tightening picked up compared with the second quarter, owing mainly to higher risk perceptions related to the economic outlook and borrower-specific situations, alongside lower risk tolerance on the part of banks. Credit standards for consumer credit and other lending also tightened further, albeit at a slightly moderating pace. For the fourth quarter of 2023, euro area banks expect credit standards for loans to households for house purchase to remain broadly unchanged, while a further net tightening is expected for consumer credit and other loans to households.
Banks reported a substantial decrease in loan demand from firms and households in the third quarter of 2023, which exceeded previous expectations by banks. The drop in demand for loans to firms was driven mainly by higher interest rates and lower fixed investment. For housing loans, the decrease was driven by higher interest rates and, to a lesser extent, by the weakening housing market prospects and low consumer confidence. For the fourth quarter of 2023 banks expect a further, albeit less pronounced, net decrease in demand for loans to firms and housing loans.
Furthermore, banks report that the phasing-out of the ECB’s non-standard monetary policy measures has contributed to the weakening lending dynamics owing to its impact on bank funding and liquidity positions. In the third quarter of 2023 banks’ access to funding deteriorated in all market segments, especially retail funding. Banks indicated that the reduction of the ECB’s monetary policy asset portfolio and the phasing-out of TLTRO III had had a negative impact on their financing and liquidity conditions, resulting in the build-up of further tightening pressure on the supply of credit. This contributed to the tightening of terms and conditions and to downward pressure on loan volumes, both of which are expected to intensify in the coming six months. Meanwhile, banks reported that the impact of the key ECB interest rate decisions on their net interest margins continued to be markedly positive and that the impact of the ECB’s monetary policy asset portfolio on profitability was positive overall. However, the positive effects on net interest income are expected to moderate over the next six months, being increasingly offset by capital losses and higher provisioning needs.
Weakness in bank lending to firms and households continued in August and September, amid higher lending rates, lower loan demand and tighter credit standards. The annual growth rate of loans to NFCs declined to 0.2% in September, down from 0.7% in August and 2.2% in July (Chart 20, panel a), amid considerable heterogeneity across countries and maturities. The slowdown reflected the strong decrease in loan demand, in part owing to higher borrowing rates and associated spending plan cuts, as well as the further tightening of credit standards. Monthly flows showed some volatility, with a large net redemption of loans to NFCs in August that was partly reversed in September. On average, monthly flows of loans to NFCs and households have been close to zero since the beginning of 2023. The annual growth rate of loans to households fell to 0.8% in September, down from 1.0% in August and 1.3% in July (Chart 20, panel b), amid negative housing market prospects, a further tightening of banks’ credit standards and higher lending rates. The decline was driven mainly by housing loans and loans to sole proprietors (i.e. unincorporated small businesses), while consumer loans remained more resilient, despite tightening credit standards and lower consumer confidence.
Chart 20
MFI loans in selected euro area countries
(annual percentage changes; standard deviation)
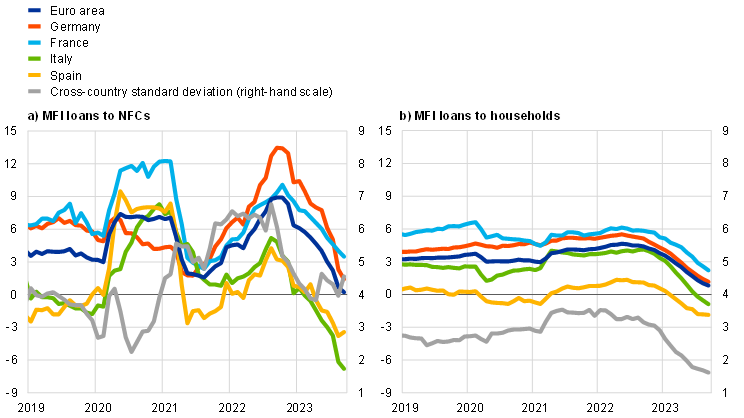
Source: ECB.
Notes: Loans from monetary financial institutions (MFIs) are adjusted for loan sales and securitisation; in the case of non-financial corporations (NFCs), loans are also adjusted for notional cash pooling. The cross-country standard deviation is calculated using a fixed sample of 12 euro area countries. The latest observations are for September 2023.
The reallocation from overnight deposits to time deposits continued in August and September, amid considerable volatility in firm deposits. The annual growth rate for overnight deposits reached new historical lows, standing at -11.4% in September and -12.0% in August, down from -10.5% in July (Chart 21). The rise in interest rates has translated into a widening of the spread between time and overnight deposits given that, in line with previous tightening cycles, interest rates on overnight deposits have adjusted to policy rate changes more slowly than those on time deposits. This has pushed up the opportunity cost of holding liquid assets and is driving the ongoing fund reallocation from overnight to time deposits. Households initially reacted more gradually than firms but have, over the last few months, shifted larger volumes into time deposits and other assets with higher remuneration than into overnight deposits and deposits redeemable at notice, partially in response to government initiatives. The fact that the ECB’s policy tightening has been faster than in previous tightening cycles explains the extraordinary volumes being reallocated.
Chart 21
M3, M1 and overnight deposits
(annual growth rate, adjusted for seasonal and calendar effects)

Source: ECB.
Note: The latest observations are for September 2023.
Annual money growth declined further, driven by high opportunity costs, subdued credit growth and the reduction in the Eurosystem balance sheet. Annual broad money (M3) growth in the euro area reached a new historical low of ‑1.3% in August and remained close to this level in September, at -1.2%, after standing at -0.4% in July (Chart 21). Monthly flows showed some volatility, with sizeable outflows in July and August virtually offset by a large inflow in September, which was driven by inflows from the rest of the world amid exceptionally high issuance of euro area government bonds. Annual narrow money (M1) growth remained at deeply negative rates, standing at -9.9% in September, after -10.4% in August and -9.2% in July. Overall, several factors continue to weigh on monetary dynamics. First, there has been a virtually zero contribution from loans to the private sector in recent months. Second, the ongoing reduction in the Eurosystem’s asset portfolio is draining liquidity from the financial system as government bonds mature, thereby reducing the volume of deposits. Third, TLTRO repayments and the higher opportunity cost to depositors of holding liquid assets are leading banks to issue bonds with longer maturities not included in M3.
Boxes
1 Global production and supply chain risks: insights from a survey of leading companies
Although geopolitical risks and their effects on global production and trade are much debated, little empirical evidence has emerged of increased fragmentation in global value chains. Disruption caused by the coronavirus (COVID-19) pandemic, the Russian war against Ukraine and increased geopolitical tensions across the board raise questions about whether we are witnessing a trend towards deglobalisation. Most analysis to date does not find evidence of significant changes in aggregate European trade patterns. Nonetheless, the ways that firms are adjusting their trading relations and supply chain management may take time to unfold, given the challenges and costs involved in modifying business models, supply chains and contracts.[8] Survey evidence is therefore helpful to identify new trends. To this end, the European Bank for Reconstruction and Development (EBRD), the Banca d’Italia, the Deutsche Bundesbank and others have recently conducted surveys asking firms about supply chain risks.[9]
More2 The inversion of the yield curve and its information content in the euro area and the United States
Following the rapid rise in short-term interest rates since last year, the risk-free yield curves in the euro area and the United States show the steepest inversion in decades. The spread between the 10-year and the 2-year Overnight Index Swap (OIS) rates in the euro area stood at -0.4 percentage points in September, after rebounding in recent months from -0.8 percentage points, which was its lowest level since 1992 (Chart A, panel a).[10],[11] In the United States the slope stood at ‑0.6 percentage points for the Treasury curve in September, a level not observed since the early 1980s (Chart A, panel b). The inversion of the slope in both jurisdictions has been driven mainly by a stronger increase in short-term rates relative to longer-term rates. Historically, an inverted yield curve has typically preceded recessions, as illustrated in Chart A. The predictive power of the slope of the yield curve for economic downturns over near-term horizons is well documented, although common econometric models remain silent on the depth and length of a potential recession.[12]
More3 Spillovers to the euro area from recent negative inflation in China
This box discusses potential spillovers from recent negative inflation in China to euro area import prices. Economic developments in China are transmitted to euro area import prices directly via China’s export prices and indirectly via China’s important role in global demand for commodities and as a key supplier of intermediate and capital goods to the rest of the world. This box finds a tangible impact on euro area import prices, but a more limited impact on the broader euro area inflation environment.[13]
More4 Industry structure and the real effects of monetary policy
The service intensity of the euro area economy has increased since the launch of the euro. Between 1999 and 2022, the share of market services in euro area gross value added (GVA) has risen by around 4½ percentage points, from somewhat below 48% to more than 52% (Chart A, panel a). Over the same period, the GVA share of industry (including manufacturing) and construction – typically regarded as relatively capital-intensive sectors – has declined by around 2½ percentage points from around 27½% to around 25%.
More5 The drivers of recent developments in business activity expectations across sectors
Business activity expectations have deteriorated since mid-2022, with the decline occurring earlier than the weakening of economic growth in the euro area. According to the European Commission’s business survey, near-term expectations for business activity have declined in year-on-year terms since the third quarter of 2022. This deterioration has foreshadowed the subsequent slowdown in euro area economic activity, although the pace of the slowdown has differed across sectors. This box analyses a new bottom-up composite index of business activity expectations across sectors. It also assesses the role played by the structural drivers of the index using disaggregated data on expectations and limits to production from the European Commission’s business survey.
More6 Main findings from the ECB’s recent contacts with non-financial companies
This box summarises the findings of recent contacts between ECB staff and representatives of 56 leading non-financial companies operating in the euro area. The exchanges took place between 25 September and 5 October 2023.[14]
More7 Rent inflation in the euro area
The rent component is typically not a prominent driver of developments in euro area HICP, with an average contribution of 0.1 percentage points since 1999. Looking at the period since mid-2022, there has been a notable pick-up in the annual growth rate of euro area actual rental prices for housing, though more muted than the rise in other services prices. Questions on the inflationary impact of rents are largely inspired by developments in the United States, where rent inflation has been a key driver of the post-pandemic inflation surge. When assessing the scope for rents to play a similarly important role in euro area inflation dynamics, measurement issues need to be taken into account, as do the various methodological and regulatory specificities surrounding this particular HICP component.
MoreArticle
1 Happy anniversary, BLS – 20 years of the euro area bank lending survey
Since its launch in 2003, the euro area bank lending survey (BLS) has provided valuable early indications for the assessment of bank lending conditions in the euro area. The BLS is one of the longest existing Eurosystem surveys. It was launched by the Eurosystem in 2003, to enhance the knowledge of bank lending conditions in the euro area.[15] Bank credit standards (that is, their loan approval criteria), actual terms and conditions on new loans, and the demand for loans vary over the economic and monetary policy cycle and may, at times, be driven by financial crises or emergency financing needs. These developments, reported in great detail by banks in the BLS at a quarterly frequency, support the assessment of the drivers of bank lending conditions and provide early indications of bank lending dynamics, which is important for the assessment of the transmission of monetary policy.
MoreStatistics
https://www.ecb.europa.eu/pub/pdf/ecbu/ecb.eb_annex202307~a2c4fd7bb3.en.pdf© European Central Bank, 2023
Postal address 60640 Frankfurt am Main, Germany
Telephone +49 69 1344 0
Website www.ecb.europa.eu
All rights reserved. Reproduction for educational and non-commercial purposes is permitted provided that the source is acknowledged.
For specific terminology please refer to the ECB glossary (available in English only).
The cut-off date for the statistics included in this issue was 25 October 2023.
PDF ISSN 2363-3417, QB-BP-23-007-EN-N
HTML ISSN 2363-3417, QB-BP-23-007-EN-Q
According to the preliminary flash estimate released by Eurostat on 31 October, euro area real GDP declined by 0.1% in the third quarter of 2023. This estimate was not available at the time of the October Governing Council meeting.
See the box entitled “The drivers of recent developments in business activity expectations across sectors”.
Eurostat’s flash estimate for October, released after the cut-off date for this issue of the Economic Bulletin (25 October), saw headline inflation decreasing from 4.3% to 2.9%.
See “ECB Consumer Expectations Survey results – August 2023”, press release, ECB, 11 October 2023.
If the increase in the cost of interbank borrowing had also been included in the composite bank funding costs calculation, funding costs as a whole would have risen even more steeply since the beginning of the hiking cycle – albeit starting from a lower level.
See “ECB recalibrates targeted lending operations to help restore price stability over the medium term”, press release, ECB, 27 October 2022.
Owing to lags in the data available on the cost of borrowing from banks, data on the overall cost of financing for NFCs are only available up to August 2023.
See the blog posts by Di Sano, M., Gunnella, V. and Lebastard, L., “Deglobalisation: risk or reality?”, ECB, 12 July 2023, and Koh, S.-H., MacLeod, C. and Rusticelli, E., “Shifting sands: trade partner patterns since 2018”, OECD, 12 July 2023.
The EBRD survey focuses on 15 EBRD countries; see “Global supply chains in turbulence”, Transition report 2022-23, EBRD, 2022. The Banca d’Italia survey focuses on Italian firms; see Bottone, M., Mancini, M. and Padellini, T., “Navigating Fragmentation Risks: China Exposure and Supply Chains Reorganization among Italian Firms”, Banca d’Italia, 2023. The Deutsche Bundesbank survey focuses on German firms (data collection completed and analysis forthcoming).
The literature has considered various maturities for the slope, but we find little statistical difference in predictive performance for different choices for the euro area.
Euro area OIS spot rates before 1999 are backcasted using Bund yields. Results are robust to using Bund yields for the entire sample, as the predictive power in the euro area is found to be driven by core countries; see Sabes, D. and Sahuc, J. G., “Do yield curve inversions predict recessions in the euro area?”, Finance Research Letters, Vol. 52, 2023.
The predictive power of the slope of the yield curve is documented for the euro area and the United States, as well as for other advanced and emerging market economies. One of the earlier leading papers in the literature is Estrella, A. and Hardouvelis, G. A., “The term structure as a predictor of real economic activity”, The Journal of Finance, Vol. 46, No 2, 1991, pp. 555-576. For more recent surveys, see Haubrich, J. G., “Does the Yield Curve Predict Output?”, Annual Review of Financial Economics, Vol. 13, 2021, pp. 341-362, and De Backer, B., Deroose, M. and Van Nieuwenhuyze, C., “Is a recession imminent? The signal of the yield curve”, NBB Economic Review, 2019. Sabes, D and Sahuc, J. G., op. cit., finds that the lead time is six months to one and a half years for the euro area, Germany, France, Italy and Spain.
For a forward-looking analysis of the impact of a further China downside risk scenario on the euro area, see Box 3 of “ECB staff macroeconomic projections for the euro area”, published on the ECB’s website on 14 September 2023.
For further information on the nature and purpose of these contacts, see the article entitled “The ECB’s dialogue with non-financial companies”, Economic Bulletin, Issue 1, ECB, 2021.
On 15 May 2003 the ECB published, for the first time, the results of its euro area bank lending survey (for the quarters Q4 2002 and Q1 2003), together with the article entitled “A bank lending survey for the euro area”, Monthly Bulletin, ECB, Frankfurt am Main, April 2003. The Senior Loan Officer Opinion Survey on Bank Lending Practices, conducted by the Federal Reserve System in the United States, was a model for the BLS. Participation in the BLS has increased over time, with additional countries joining the euro area and additional banks being added to adequately represent the structure of the euro area banking sector.