
- STATISTICAL RELEASE
Euro area quarterly balance of payments and international investment position:
second quarter of 2023
5 October 2023
- Current account surplus at €34 billion (0.2% of euro area GDP) in four quarters to second quarter of 2023, after a €129 billion surplus (1.0% of GDP) a year earlier
- Geographical counterparts: largest surpluses vis-à-vis United Kingdom (€156 billion) and Switzerland (€74 billion) and largest bilateral current account deficits vis-à-vis China (€156 billion) and the United States (€27 billion)
- International investment position showed net assets of €265 billion (1.9% of euro area GDP) at the end of second quarter of 2023
Current account
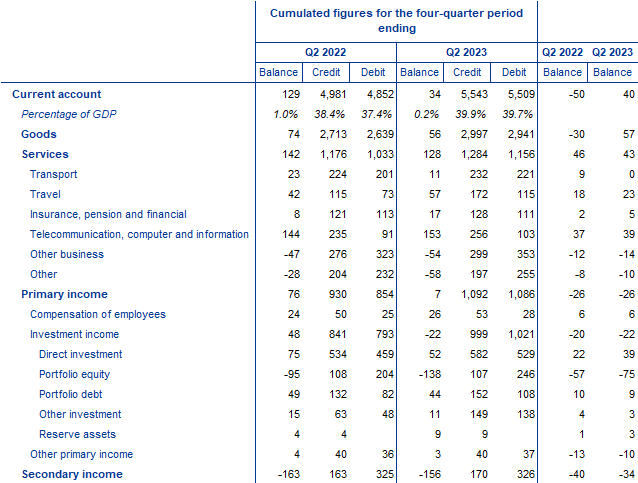
The current account of the euro area recorded a surplus of €34 billion (0.2% of euro area GDP) in the four quarters to the second quarter of 2023, after recording a surplus of €129 billion (1.0% of GDP) a year earlier (Table 1). This decline was mainly driven by a fall in the primary income surplus from €76 billion to €7 billion and by reductions in the surpluses for goods (down from €74 billion to €56 billion) and services (down from €142 billion to €128 billion). These developments were partly offset by a decline in the deficit in secondary income (down from €163 billion to €156 billion).
The lower surplus for services was mainly due to a smaller surplus for transport services (from €23 billion to €11 billion) and widening deficits for other business services (from €47 billion to €54 billion) and other services (from €28 billion to €58 billion). Larger surpluses were recorded for travel services (from €42 billion to €57 billion), telecommunication, computer and information services (from €144 billion to €153 billion) and insurance, pension and financial services (from €8 billion to €17 billion).
The decrease in the primary income surplus was mainly due to a larger deficit in portfolio equity income (from €95 billion to €138 billion), a lower surplus in direct investment income (from €75 billion to €52 billion) and a decline in the surplus for portfolio debt income (from €49 billion to €44 billion).
Table 1
Current account of the euro area
Source: ECB.
Notes: “Equity” comprises equity and investment fund shares. Discrepancies between totals and their components may arise from rounding.
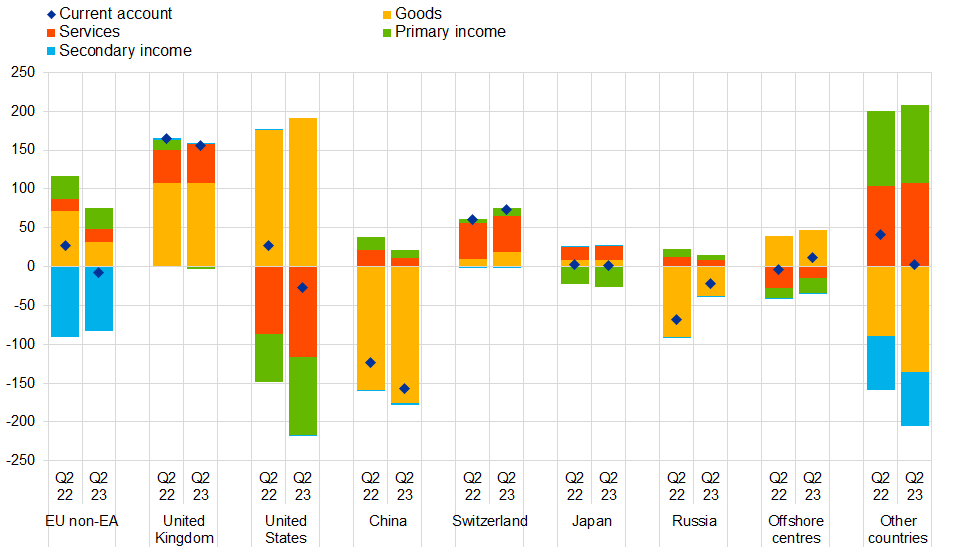
Data on the geographical counterparts of the euro area current account (Chart 1) show that, in the four quarters to the second quarter of 2023, the euro area recorded its largest bilateral surpluses vis-à-vis the United Kingdom (€156 billion, down from €165 billion) and Switzerland (€74 billion, up from €61 billion). The largest bilateral deficits were recorded vis-à-vis China (€156 billion, up from €123 billion a year earlier), the United States (€27 billion, after a surplus of €28 billion) and Russia (€22 billion, down from €68 billion).
The most significant changes in the geographical components of the current account in the four quarters to the second quarter of 2023 relative to the previous year were as follows. The deficit for goods vis-à-vis Russia fell from €91 billion to €37 billion, while the deficit for goods vis-à-vis the residual group of other countries rose from €89 billion to €136 billion. This was partly due to a larger goods deficit with Norway (up from €46 billion to €71 billion) and increased imports from countries within the Organization of the Petroleum Exporting Countries. The surplus vis-à-vis EU Member States and EU institutions outside the euro area decreased from €71 billion to €32 billion, while the deficit vis-à-vis China increased from €159 billion to €176 billion.
In services, the deficit vis-à-vis the United States increased (from €87 billion to €116 billion), while the deficit vis-à-vis offshore centres decreased (from €27 billion to €14 billion). In primary income, a larger deficit was recorded vis-à-vis the United States (up from €62 billion to €101 billion), while the primary income balance vis-à-vis the United Kingdom switched from a surplus of €13 billion to a deficit of €3 billion.
Chart 1
Geographical breakdown of the euro area current account balance
(four-quarter moving sums in EUR billions; non-seasonally adjusted)
Source: ECB.
Note: “EU non-EA” comprises the non-euro area EU Member States and those EU institutions and bodies that are considered for statistical purposes as being outside the euro area, such as the European Commission and the European Investment Bank. “Other countries” includes all countries and country groups not shown in the chart, as well as unallocated transactions.
International investment position
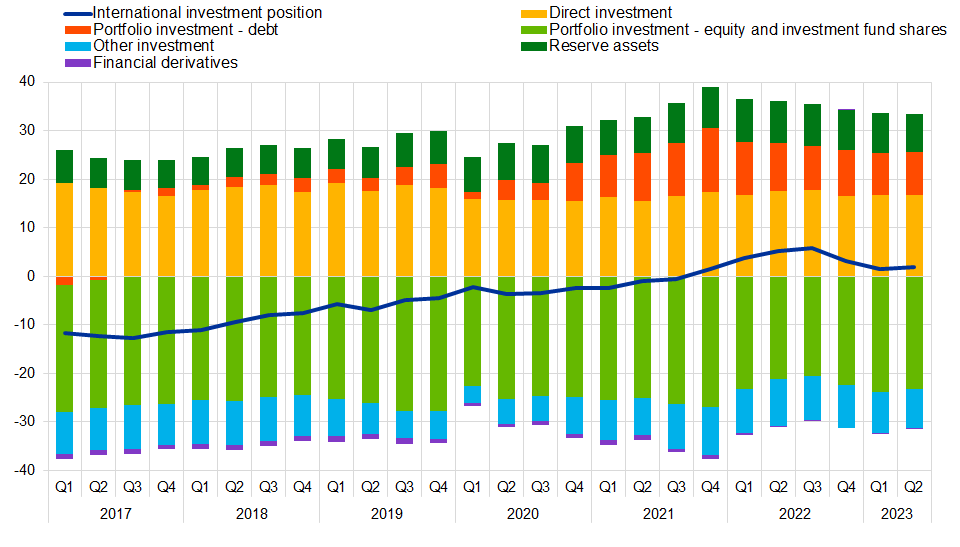
At the end of the second quarter of 2023, the international investment position of the euro area recorded net assets of €265 billion vis-à-vis the rest of the world (1.9% of euro area GDP), up from €194 billion in the previous quarter (Chart 2 and Table 2).
Chart 2
Net international investment position of the euro area
Source: ECB.
The €71 billion increase in net assets reflected contributions from all major investment components. Larger net assets were recorded in direct investment (up from €2.30 trillion to €2.34 trillion) and portfolio debt (up from €1.18 trillion to €1.21 trillion), while net liabilities declined in portfolio equity (down from €3.25 trillion to €3.22 trillion) and other investment (down from €1.15 trillion to €1.13 trillion).
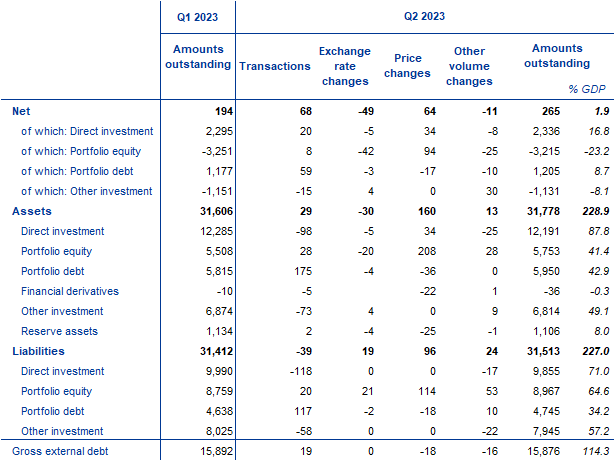
Table 2
International investment position of the euro area
Source: ECB.
Notes: “Equity” comprises equity and investment fund shares. Net financial derivatives are reported under assets. “Other volume changes” mainly reflect reclassifications and data enhancements. Discrepancies between totals and their components may arise from rounding.
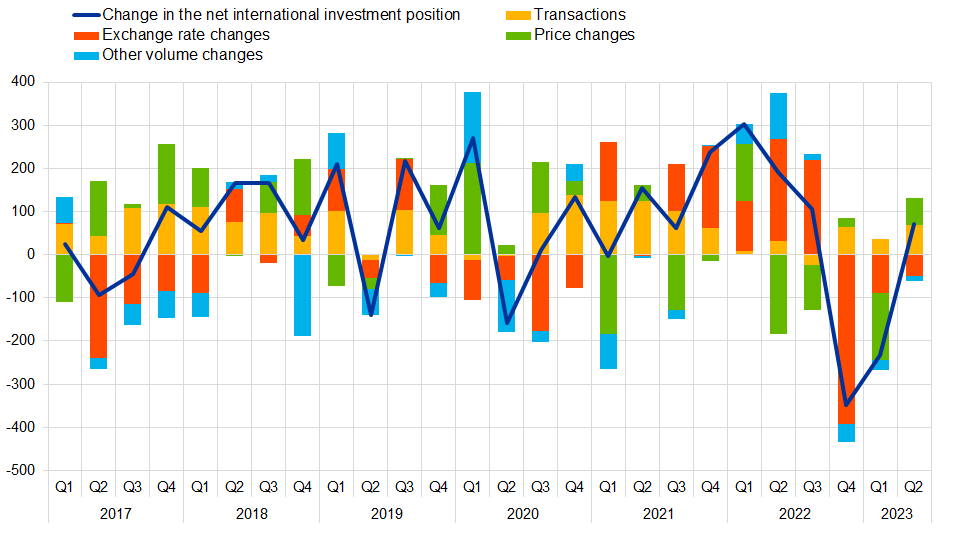
The developments in the euro area’s net international investment position in the second quarter of 2023 were driven mainly by transactions and positive net flows from price changes. These were partly offset by exchange rate changes and other volume changes (Table 2 and Chart 3).
The increase in net assets for direct investment was mostly driven by positive net flows for price changes and transactions, as the disinvestment was bigger in liabilities than in assets (Table 2). The decrease in net liabilities for portfolio equity resulted mostly from price changes, which were partially offset by negative exchange rate changes and other volume changes. In portfolio debt, the changes were mainly explained by positive net flows owing to transactions. The decrease in other investment net liabilities was mostly due to other volume changes.
At the end of the second quarter of 2023 the gross external debt of the euro area amounted to €15.9 trillion (114% of euro area GDP), down by €16 billion compared with the previous quarter.
Chart 3
Changes in the net international investment position of the euro area
Source: ECB.
Note: “Other volume changes” mainly reflect reclassifications and data enhancements.
Data revisions
This statistical release incorporates revisions to the data for the reference periods between the first quarter of 2019 and the first quarter of 2023. The revisions reflect revised national contributions to the euro area aggregates as a result of the incorporation of newly available information.
Next releases
- Monthly balance of payments: 19 October 2023 (reference data up to August 2023).
- Quarterly balance of payments and international investment position: 11 January 2024 (reference data up to the third quarter of 2023)[1]
For queries, please use the Statistical information request form.
Notes
- Data are neither seasonally nor working day-adjusted. Ratios to GDP (including in the charts) refer to four-quarter sums of non-seasonally and non-working day-adjusted GDP figures.
- Hyperlinks in this press release lead to data that may change with subsequent releases as a result of revisions.
On 27 October 2023 there will be a second release of the quarterly balance of payments and international investment position data (reference data up to the second quarter of 2023) with revisions to data for periods since at least the first quarter of 2013. This second release will not include a press or statistical release and is aimed at ensuring consistency between the balance of payments/international investment position and the euro area sector accounts.