


Is there a digital divide in payments? Understanding why cash remains important for so many
Published as part of the ECB Economic Bulletin, Issue 2/2024.
1 Introduction
Is the constant trend towards the digitalisation of payments creating a binary world of digital “haves” and analogue “have-nots”? By assessing payment patterns in the euro area using detailed survey data, the results presented in this article challenge two prevailing assumptions. First, we contest the idea that cash is only used by people who are less connected to the digital world, by illustrating high cash usage across people with access to digital payment tools. Second, we revisit the notion that the digitalisation of payments is a uniform process, by showing that people with more limited access to digital payment tools have diverse sociodemographic profiles. Furthermore, results show that adoption of digital payment tools is not driven solely by supply-side limitations, hinting at the significant role of personal choice and the persistence of habits. The insights gained enrich our understanding beyond a one-size-fits-all approach to everyday payments in the digital age. The findings are in line with the approach adopted by the Eurosystem to cash and payments, which aims to ensure the availability and acceptance of cash while embracing digital innovation.
2 Cash and its persistence in a digitalising world
Assessing the digitalisation of payments beyond surface-level trends reveals a more nuanced reality, with cash use remaining persistent among a broad spectrum of the population despite increasing digital adoption. Despite having a highly developed financial system and growing digitalisation, the euro area contains a significant number of people across most demographics who opt to use cash for everyday transactions. Survey data from the ECB’s Study on payment attitudes of consumers in the euro area (SPACE) provide valuable insights into the diverse ways in which different segments of the population interact with cash.[1] According to the SPACE findings, there has been a marked decline in the proportion of point-of-sale transactions conducted in cash, down from 79% in 2016 and 72% in 2019 to 59% in 2022. This figure does, however, mask the existence of mixed users, with up to 74% of people conducting at least one transaction in cash on any given day in 2022, which underscores the continued importance of cash alongside digital payment options. Contrary to other developed economies with lower cash usage, the euro area can be seen as a distinct example where the tangible benefits of cash seem to be widely perceived by the population. However, the reasons behind the persistent usage of cash in the digital age are not fully understood as they are complex and multifaceted, spanning from practical constraints to ingrained habits and preferences, which has recently prompted academic research on the matter.[2]
But are these cash usage patterns in the euro area driven by people less connected to the digital world, or are they the result of a more complex reality of individual preferences and behaviours? As digitalisation has advanced, it has often given rise to a digital divide in access to technology.[3] This phenomenon has been extensively explored in the context of internet and computer access but less so in payment methods.[4] In the digital divide literature, the “access divide” is typically referred to as the “first-level” digital divide. This is contrasted with the “second-level” divide that involves disparities in digital skills and similar aspects.[5] Access to digital payments in the euro area is primarily facilitated by having debit and credit cards or payment accounts. In this article, instead of access, we adopt a narrower measure than the traditional literature to assess a potential digital divide in payments: reported ownership of tools enabling digital payments, namely credit and debit cards and payment accounts.[6] Throughout our discussion, we use the term “digital payment tools” to specifically refer to these primary enablers of digital payments.
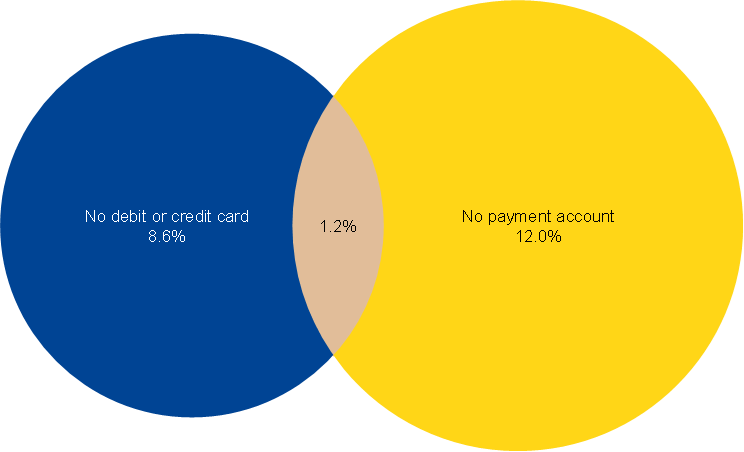
The group we will focus on, which for the sake of simplicity we will refer to as the “less digitalised group”, comprises individuals who report not having either a debit or credit card or a payment account. To analyse this group’s payment behaviour, we used representative SPACE data collected by the ECB in 2022, encompassing a one-day payment diary and a survey questionnaire completed by nearly 40,000 consumers across 17 euro area countries.[7] As shown in Chart 1, the main observation is that nearly a fifth of the respondents report not having at least one of these two common digital payment tools. This share, extrapolated to the whole adult population in these 17 countries, would amount to around 40 million individuals. This implies that the influence of this group on the payments landscape is far from negligible.
Chart 1
Lack of ownership of common digital payment tools
Nearly one in five adults (19.5%) in the euro area reports not having either debit or credit cards or payment accounts
(share of population)
Source: ECB (SPACE 2022 survey).
Notes: The data encompass all euro area countries apart from Germany, Croatia and the Netherlands. The sample is representative and consists of nearly 40,000 respondents. The results vary across countries, although in most countries, the group of people reporting not having either cards or payment accounts represents between 13% and 27% of the national population.
The high share for the less digitalised group may stem partly from the nature of the reported data and may encompass not only people not having digital payment tools but also individuals unaware that they have such tools. Hence, reported figures mainly include individuals without cards or accounts, but could also point to a lack of awareness or low usage of either payment tool. For example, in the case of individuals reporting not having payment accounts, it is likely that these include a portion of the “underbanked”: people who have payment accounts but rarely use them. Another reason for the high number is the surprisingly small overlap between the two subgroups, as shown in Chart 1.[8] This overlap between people lacking both an account and a card could be explained by several factors: some may rely on other people for financial transactions (for example, their cards may be linked to a family member’s account) or use alternative forms of payment card not linked to accounts (such as prepaid cards), while others may simply have different financial strategies that do not fit conventional patterns. For example, 25.9% of non-account holders made a payment with a card during the day of the survey.
3 Beyond the binary: payment spectrum rather than payment divide?
In this section, we examine whether there really is a sharp divide in the use of payment methods or whether the situation is in fact more nuanced. In the broader literature on access to digital technology like computers and the internet, the term “digital divide” has been attacked for oversimplifying a complex reality.[9] We find that this critique applies to digital payments as well. The idea of a stark divide in ownership of digital payment tools does not fully capture the reality of everyday payments. First, we assess differences in the cash habits and sociodemographic profiles of individuals without either cards or payment accounts. The analysis suggests certain differences but, as with the broader digital divide, variations are a matter of degree. Then, we also study the possible reasons why people might be inclined not to have a common digital payment tool, focusing on aspects like physical banking presence and the persistence of cash usage.
Assessing cash habits and sociodemographic profiles
A comparison of cash-related behaviours reveals more similarities than differences between people with and without cards or accounts, albeit with the latter expected to have a greater preference for cash. Chart 2 shows how notable cash habits, preferences and attitudes towards cash attributes compare among both groups. Of those making payments during the day of the survey, 80% of people without a card or account conducted at least one cash payment, compared with 73% of the remaining population. Regarding store of value, 43% of the less digitalised group kept cash reserves at home against 38% for others. The gap widens when it comes to receiving part of their income in cash: 32% for those without cards or accounts against 15% for the rest. In terms of reported preferences, 65% of the less digitalised group consider cash important, a view echoed by 56% of others. Interestingly, individuals stating to have no clear preference between cash and cashless methods stands evenly at 22% across both groups, but the less digitalised group are nearly twice as likely to strictly prefer cash (31%) than the broader population (17%). When it comes to the perceived advantages of cash, the less digitalised group are more likely to prefer the ease and safety of cash over cards, at rates of 26% and 22% respectively, compared with 18% and 16% among the rest. Yet, they are less likely to cite cash as helping them to keep track of their spending or protecting their privacy – the most popular attributes of cash among the general population. Hence, despite the greater relative preference for cash among the less digitalised group, especially in income partly paid in cash and preferred tools, a substantial portion of the broader population also shows high cash usage patterns.
Chart 2
Differences in habits and preferences towards cash
(share of population in each group, percentages)
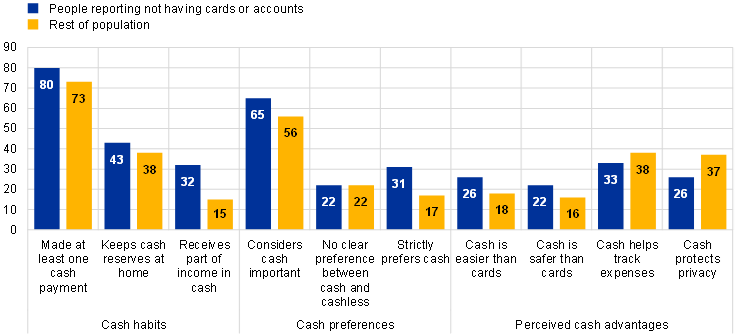
Source: ECB (SPACE 2022 survey).
Notes: These graphs show the differences in the averages of cash-related variables (expressed as percentages) between the less digitalised group and the rest of the population in the 17 countries analysed. For the variable “Made at least one cash payment”, the individuals taken into consideration are those saying they made payments at a point-of-sale on the day of the survey.
But can we link the lack of cards or accounts to a specific demographic profile? The descriptive analysis summarised in Chart 3 suggests that while there is not an absolute divide in sociodemographic characteristics, notable gaps emerge in financial literacy and digital skills. For instance, 18% of individuals without digital payment tools earn a high income (defined as over €3,000 monthly) compared with 31% of the rest of the population.[10] And while education levels are relatively close, with an average of 13.4 years of education for the less digitalised group against 13.8 years of education for others, there is a lower share of individuals holding a university degree without cards or accounts.[11] While very similar percentages of both groups live in urban areas, those not having cards or accounts tend to be younger – 25% of people aged between 18 and 30 against 15% of their older counterparts – indicating that the less digitalised group are younger than the rest.[12],[13] This might be because younger individuals – often students or people just starting their careers – are relying on family support or still gaining financial independence, impacting their ownership of digital payment tools.[14] The differences become more pronounced in financial literacy, where only 12% of less digitalised people have financial investments, as opposed to 28% of the broader population, and a similar pattern is seen with pension funds. This tendency extends to proxies for digital skills: 78% of the less digitalised group use the internet daily, less than the 87% of the general population that do so, and a larger gap exists in online banking, with 41% against 64% respectively.
Chart 3
Differences in sociodemographic profiles, financial literacy and digital skills
(share of population in each group, percentages)

Source: ECB (SPACE 2022 survey).
Notes: These graphs show the differences in the averages of demographic variables (expressed as percentages) between the less digitalised group and the rest of the population in the 17 countries analysed. Income refers to net monthly household income. An urban area is defined as an agglomeration with at least 50,000 inhabitants.
Hence, evidence shows that individuals who report not having at least one digital payment tool (whether cards or accounts) are a diverse group, proving that there is no one-size-fits-all profile. This group includes younger, mostly urban individuals who tend to use more cash on average, as well as people with lower levels of financial and digital know-how. The diversity of this group undermines the idea that digitalisation results in a homogeneous, marginalised segment, presenting a picture far from a stark digital divide.[15] So far, we have examined average differences between the two groups across various factors, but these differences do not account for how these factors interact with each other, and to what extent they influence the likelihood of lacking digital payment tools. For example, we showed that the less digitalised group tend to be younger, but this does not demonstrate whether being less digitalised is solely due to their age. A young consumer might not have a bank account not just because they are young, but also because of factors typically associated with youth, such as education level, income or employment status. For a clearer idea of how these factors combine in influencing a person’s likelihood of belonging to the less digitalised group, Chart 4 presents a simplified view of our regression analysis. Each bar in the chart represents the impact of a different factor: bars extending to the right indicate a positive association (meaning the factor increases the likelihood of a person belonging to the less digitalised group, relative to the rest of the population), while bars to the left show a negative association. This analysis confirms and reinforces previous findings.[16] It reveals that interaction with cash (blue bars), urban living, lack of employment, youth and lower incomes (yellow bars), low financial literacy (green bars) and digital skills (light blue bars) collectively influence being considered in the less digitalised group.[17] Despite the long list of factors analysed, however, other determinants could also be influential in determining ownership of digital payment tools. Two interesting factors added in Chart 4 – the persistence of cash habits and the non-influence of perceived physical banking presence – will be explored further in the next section.
Chart 4
Combined effect of variables on the decision to not have a card or payment account
(standardised “marginal effects” of population in each group)

Source: ECB (SPACE 2022 survey).
Notes: The chart shows simplified results of the marginal effects from a probit regression, showing which factors are linked to decreased ownership of digital payment tools. The vertical zero dotted line serves as a reference point; red confidence bars that do not cross this line indicate a statistically significant effect. The estimates are relative: for instance, the negative direction for the privacy factor suggests that it is valued less by this group compared with the general population, not that they do not value privacy at all. The results for categorical and continuous variables have been standardised, making it possible to directly compare the magnitude of the impact of all variables on the likelihood of not having common digital payment tools. The estimates suggest that while the marginal effects are noticeable, they are not overwhelmingly large, which may indicate that other unaccounted factors could also be influential in determining ownership of digital payment tools. Additionally, these estimates do not confirm whether any single factor directly causes lack of ownership. This is important because of potential issues like reverse causation (it is unclear whether A causes B or B causes A) or where outside factors not considered could affect the results. The regression was calculated with a sample size of 37,262 individuals, using robust standard errors and country fixed effects.
Cash habits and lack of digital payment tools: economic necessity or personal choice?
Personal choice, together with the diversity of individual situations, may be more important than external constraints to explain cash usage and having digital payment tools in the euro area. As shown in Chart 2, the prominent use of cash in the euro area by individuals both with and without digital payment tools implies that the preference for cash extends beyond mere availability and could represent a deliberate choice in many cases. Yet, questions remain about not having digital payment tools like cards or accounts, where factors like habit stickiness, personal barriers and external constraints may play a role, as shown in Chart 4. For example, while personal constraints like financial and digital literacy or lower income certainly influence these decisions for some people, they alone do not capture the diverse reasons among different demographic groups. And unlike global trends, where distance from financial institutions and service costs are key barriers, these issues might be less influential in the euro area’s advanced financial system.[18] Indeed, our analysis below points to the limited influence of two external factors (physical banking presence and the reported changes in behavioural patterns after the pandemic), hinting that personal choice is of greater importance.[19]
Physical banking presence is not significantly different for people lacking cards or accounts compared with the rest of the population, indicating that they do not seem to face a stronger supply-side barrier. Survey data provide a good proxy for physical banking presence, capturing whether people find it easy or difficult to reach a bank branch or an ATM to withdraw cash.[20] As shown in Chart 4 above, physical banking presence has no statistical effect on the decision not to have a card or account. This suggests that in the euro area, unlike less well developed regions (Box 1), the distance from bank branches has little impact, indicating a stronger role for personal preference and personal constraints.[21] This idea is further reinforced as illustrated in Chart 5, panel a) below, where a small, statistically insignificant difference is observed between the two groups. Additionally, no average difference emerges when analysing the population coverage of branch and ATM networks in the regions where individuals reside.[22],[23]
Chart 5
Physical banking presence and persistence of cash habits: two factors with little influence on belonging to the less digitalised group
a) Physical banking presence | b) Persistence of cash habits after the pandemic |
|---|---|
(share of population in each group, percentages) | (share of population in each group, percentages) |
|
|
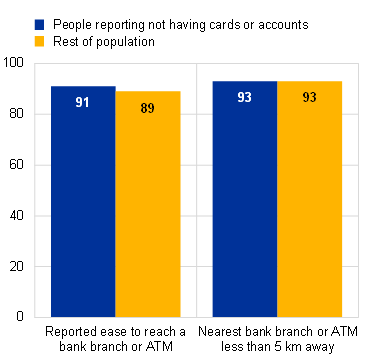
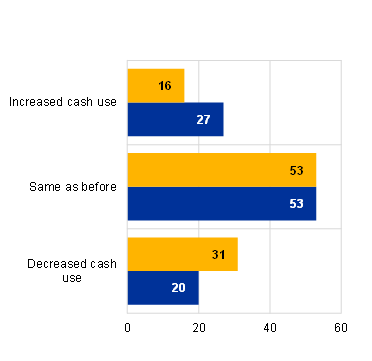
Source: ECB (SPACE 2022 survey) and Eurosystem data on population coverage of bank branches and ATMs.
Notes: Panel a) shows (i) the share of the population that report finding it easy to reach a bank branch or an ATM when they need to withdraw cash, and (ii) the share of the population living in a region with a bank branch or ATM located within 5 km of their home on average. By contrast, panel b) shows the share of individuals that have increased, maintained or decreased their cash usage compared with just before the pandemic.
Half of less digitalised individuals report continuing to use cash as much as before the pandemic, with almost a third even increasing their usage, indicating a significant persistence of cash habits. The pandemic was a significant disruptor of financial habits and provided a unique opportunity to observe how individuals change behaviour when conditions change. Typically, behaviour changes from within – gradually and subtly, driven by personal preferences, like starting to use new payment tools in certain circumstances for the sake of convenience. However, external (or exogenous) shocks like the pandemic often precipitate abrupt shifts in behaviour, offering a clear window to understand the stickiness of certain habits. Chart 5, panel b) shows that not only half of the less digitalised group maintained their usage of cash in physical payments, but almost a third of the group increased such usage.[24] This finding contrasts with the rest of the population, where only about 16% reported increased use of cash, indicating that the less digitalised group’s behaviour is notably distinct. The persistence of cash usage among some individuals, even in the face of external shocks, underscores the resilience of cash habits and casts doubt on preconceived notions about the inevitability of a universal digital transition.
Box 1
Unbanked beyond the euro area: do digital ownership patterns differ abroad?
How does the use of euro cash as a foreign currency differ between banked and unbanked individuals outside the euro area? So far, our main analysis has focused on factors influencing the likelihood of people being less digitalised in banking terms in the euro area. But it is important to assess if these results also hold in economies with different financial market conditions. The OeNB Euro Survey conducted by the Oesterreichische Nationalbank collects information on cash holding and saving behaviour for a group of countries in central, eastern and south-eastern Europe (CESEE). [25],[26] This makes it possible to assess differences in patterns between the euro area and the CESEE region and facilitates the study of the determinants of the decision to hold a bank account, along similar lines to the main analysis.
The findings for the CESEE region reveal two key differences from the euro area: bank account holders are more likely to hold euro cash, and there is a notable disparity in perceptions of banking access between banked and unbanked individuals. Specifically, 30.2% of individuals with bank accounts also hold euro cash reserves, while only 10.4% of people without bank accounts do so. This suggests that banked individuals may view euro cash as a stable savings option or a safeguard against local currency fluctuations, or they may simply have easier access to it. Furthermore, banked individuals tend to have connections abroad, possibly as a result of receiving remittances, working temporarily in the euro area or travelling on holiday. There is a marked difference from the euro area regarding physical banking presence or proximity to banking services, with 47% of unbanked individuals reporting that it takes a long time to reach the nearest bank branch compared with 36% of those with bank accounts.
A statistical analysis similar to the one shown in Chart 4 confirms that the two previous findings affect the likelihood of an individual holding an account and reveals further determinants of the probability of being unbanked in these countries. Sociodemographic factors like higher income, higher education and older age are linked to holding a bank account, similar to trends observed in the euro area. Additionally, confidence in financial institutions plays an important role: a belief in the safety of bank deposits and trust in the national central bank increase the likelihood of someone holding an account.
4 Acknowledging diversity: ensuring access to cash in an increasingly digital economy
Based on the findings set out above, we see a nuanced picture of cash use and digital payment tool ownership in the euro area, casting doubt on the idea of a binary digital divide in payments. First, the prevalence of cash usage – observed in both the less digitalised group and the rest of the population – highlights the continued relevance of cash in an increasingly digital economy, although it has suffered a relative decline in use in transactions. Second, the demographic profile of those not having a digital payment tool is very diverse, indicating a broad and varied – rather than a small, homogeneous, marginalised – group. Third, the seemingly limited role of perceived physical banking presence in influencing ownership of cards or accounts points to there being a complex range of issues behind decision-making. This complexity is further illustrated by the persistence of cash habits by a significant share of the population, even after the pandemic.
These insights collectively underscore the multifaceted nature of financial and payments behaviour in the euro area. This understanding makes it necessary to acknowledge the importance of choice and personal circumstances in financial and payment decisions, as well as the crucial role of maintaining access to cash alongside digital options.
This is why, in this fast-evolving and diverse digital landscape, the Eurosystem’s role is to support and respect the diverse payment preferences across the euro area. This approach acknowledges the value of choice in financial transactions, where cash continues to play a significant role for a considerable portion of the population. The Eurosystem’s cash strategy involves regular assessments of cash services and infrastructure to identify areas where access might be diminishing.[27] This includes monitoring the distribution and availability of bank branches and ATMs and identifying remote or underserved areas. Despite this not being a factor that differentiates the less digitalised group from the rest of the population, access to cash is an important aspect that may affect payment choices and have major consequences for consumers.[28] By ensuring that cash remains easily accessible, the Eurosystem aims to provide a safety net that respects and supports those who, by choice or circumstance, opt for cash as a payment option.
These efforts are about maintaining a balanced financial ecosystem where all preferences are catered for rather than compensating for a lack of digital adaptation. While encouraging and facilitating digital innovation in payments, the Eurosystem remains equally committed to ensuring that cash continues to be a viable, efficient and secure payment option.[29] This dual approach reflects an understanding that a healthy financial ecosystem is one where digital progress and cash coexist, both serving the needs of society. This balanced perspective is crucial at a time when financial behaviours are diverse and evolving, ensuring that all preferences are respected and supported as the euro area economies navigate a complex and uneven digitalisation process.
5 Conclusion
While the term “divide” in the ownership of digital payment tools suggests a stark separation, our analysis reveals a more nuanced reality in the euro area where cash remains integral alongside digital options. Many individuals with and without digital payment tools frequently use cash, indicating that the division is not as clear-cut as is often implied. Though some people may struggle digitally, it would be a fallacy to believe that because some less digitalised groups are reliant on cash, then all cash users are necessarily less digitalised. This misconception is challenged by the diverse sociodemographic profiles within the approximately 20% of the population enjoying limited access to at least one common digital payment tool, challenging preconceived notions about their uniformity. The persistence of cash habits, even amid external shocks like the pandemic, and the seemingly little influence of perceived physical banking presence on having digital payment tools illustrate the complexity of financial behaviours. Against this backdrop, the Eurosystem is committed not only to preserving cash in recognition of these varied circumstances but also to enhancing the payment ecosystem. This includes exploring options for a digital euro. This approach aims to bolster resilience and diversity in the financial landscape, ensuring that all payment preferences are taken into consideration in the euro area.
European Central Bank, “Study on payment attitudes of consumers in the euro area (SPACE)”, 2022.
There is an emerging literature, extending beyond the euro area, that aims to explain the persistence of cash usage despite financial innovation. See, for example, Alvarez, F. and Argente, D., “On the Effects of the Availability of Means of Payments: The Case of Uber”, The Quarterly Journal of Economics, Vol. 137, No 3, 2022, pp. 1737-1789; Alvarez, F., Argente, D., Jiménez, R. and Lippi, F., “Cash: A Blessing or a curse?”, Journal of Monetary Economics, Vol. 125, 2022, pp. 85-128; Brown, M., Hentschel, N., Mettler, H. and Stix, H., “The convenience of electronic payments and consumer cash demand”, Journal of Monetary Economics, Vol. 130, 2022, pp. 86-102.
A related question is what is driving connectedness to the digital world more generally, which is mostly addressed by the literature on the digital divide. This literature, primarily focusing on information and communication technology (such as computers and the internet) is vast and started in the 1990s. Originally seen as a gap in technology access (“first-level” divide), the digital divide is now understood as a multifaceted process encompassing not only access but also motivation, skills and actual usage. See, for example, Van Dijk, J., “Digital Divide: Impact of Access”, The International Encyclopedia of Media Effects, 2017.
While the financial inclusion literature is an important exception in examining inequalities in the adoption of digital payment tools (particularly bank account ownership and with a focus on developing countries), it often overlooks the potential benefits of cash, as highlighted by critics. Our analysis of payment patterns in the euro area offers a unique perspective, situated between widespread cash usage in developing economies and the move towards cashless societies in some developed countries. For an overview of financial inclusion research and its shortcomings, see Demirgüç-Kunt, A., Klapper, L. and Singer, D., “Financial Inclusion and Inclusive Growth: A Review of Recent Empirical Evidence”, Policy Research Working Papers, No 8040, The World Bank Group, 2017, and Mader, P., “Contesting Financial Inclusion”, Development and Change, Vol. 49, No 2, 2018, pp. 461-483.
Recent research sheds light on differing financial and payment behaviours related to literacy and age, but less so regarding ownership of payment tools. See van der Cruijsen, C. and Reijerink, J., “Uncovering the digital payment divide: understanding the importance of cash for groups at risk”, Working Papers, No 781, De Nederlandsche Bank, 2023, and Doerr, S., Frost, J., Gambacorta, L. and Qiu, H., “Population ageing and the digital divide”, SUERF Policy Brief, No 270, 2022.
The questionnaire of the SPACE survey includes questions referring to “debit and credit cards” and “payment accounts”, without explicitly defining them for respondents. Generally, debit and credit cards exclude prepaid cards. A payment account typically refers to an account that enables the making of payment transactions, such as placing, transferring, or withdrawing funds. These two tools (cards and accounts) enable other types of digital payment means or channels, including online payments, linkages to online payment platforms (e.g. PayPal), or credit transfers.
The SPACE report covers the entire euro area, but the data for Germany and the Netherlands are taken from national payment surveys and are consequently not used in this detailed analysis. Croatia is not included as it only joined the euro area in 2023. The sizes of the samples from each country were set to achieve specific numbers of point-of-sale transactions, reflecting the country’s size. To guarantee representation of the population and every day of the week, the sampling approach incorporated quotas based on gender, age group and the day that transactions were documented in the payment diary.
This small overlap is also confirmed by World Bank microdata (Global Findex Database 2021). Respondents were asked to report whether they have “an account at a bank or at another type of financial institution (...) or (…) a debit card”. According to these data, those reporting to have neither a bank account nor a debit card (a subset similar to the overlap subset of Chart 1) represent around 2% of the euro area population. As the SPACE data make it possible to assess these two groups separately (not having a debit or credit card and not having a payment account), we are able to evaluate those not having at least one of these tools.
Van Dijk, J., op. cit.
Income refers to net monthly household income.
Years of education are calculated in line with the highest education level achieved by the respondent, running from primary school to PhD and higher.
This difference may be attributed to the employment status of younger people, as they are more likely to still be students or unemployed, and hence do not have a card or bank account.
An urban area is defined as an agglomeration with at least 50,000 inhabitants.
Another possibility is that emerging patterns among this demographic are signalling a departure from the traditional reliance on both cards and accounts. For example, the need for a card may be less pronounced for people under 30 – a group characterised by higher online payment use – because having just an account can facilitate mobile payments or enable transactions through services like PayPal. Although these alternatives are not yet dominant in online payments, their use has been increasing.
While vulnerable groups are proven to be more reliant on cash and struggle digitally (see references below), our results show that it does not follow that all cash users or people lacking a digital payment tool are part of a vulnerable group. For work on the reliance of cash in groups of vulnerable people, see Broekhoff, M.-C., van der Cruijsen, C., Jonker, N., Reijerink, J., Umuhire, G. and Vinken, W., “Digitalisation of the payment system: a solution for some, a challenge for others”, De Nederlandsche Bank, 2023, and van der Cruijsen, C. and Reijerink, J., op. cit.
As a robustness check, we conducted parallel analyses for two separate subgroups: those without debit or credit cards and those without bank accounts. The outcomes of these additional checks align with our main findings presented in Chart 4, with the estimated coefficients having the same direction and similar magnitude across these subsets and the less digitalised group. This consistency indicates that all three subsets of the population – including the combined less digitalised group analysed in Chart 4 – exhibit similar patterns.
Although the concept of a fixed cost for setting up payment accounts suggests a potential income threshold for account ownership, our analysis – including visual inspection and statistical tests – does not confirm such threshold behaviour. This indicates that factors beyond the direct costs of account setup, possibly including various income-related variables, might influence the decision to use digital payment tools, suggesting a more nuanced relationship than initially proposed.
Globally, “lack of money”, “financial services are too expensive” and “financial services being too far” are the three most cited reasons for not having a bank account. See Demirgüç-Kunt, A., Klapper, L., Singer, D. and Ansar, S., “The Global Findex Database 2021: Financial Inclusion, Digital Payments, and Resilience in the Age of COVID-19”, The World Bank Group, 2021.
Another important external factor not directly considered in the text is the degree of merchant acceptance of cash and cards. In terms of averages, there are no large differences between the two groups (cash acceptance is at 97% for the less digitalised group and 96% for the rest of the population, and for card acceptance the figures are 82% and 84% respectively). However, when these variables are included in a regression like the one shown Chart 4, higher card acceptance seems to slightly reduce the likelihood of not having at least one digital payment tool, while cash acceptance has no effect statistically.
Despite the rise of online services, banks’ physical outlets are still an important mechanism for consumers to adopt digital means of payment.
However, nuances emerge when examining the intensity of use and adaptation strategies to the monetary costs associated with cash access. The less digitalised group tends to use the cash infrastructure more frequently and exhibits a pronounced tendency to avoid transaction fees associated with cash withdrawals (as seen in the last factor of Chart 4, “Never pays ATM fees”). This behaviour implies an adaptation to avoid direct monetary costs yet it potentially incurs other, less visible, expenses, such as the cost of travelling to access cash, the time spent travelling to access cash and the effort required to adapt to varying cash access points.
The regions are defined at the NUTS 2 level, for a total of 111 regions in the 17 countries considered. A description of this coverage indicator used for these regions is the average share of the population with bank branch or an ATM within 5 km of their residence as the crow flies. The Eurosystem calculates these and more sophisticated metrics to monitor access to cash; see the article entitled “Guaranteeing freedom of payment choice: access to cash in the euro area”, Economic Bulletin, Issue 5, ECB, 2022. Other more refined metrics, such as 1 and 2 km coverage, mean distance or ATM density, all show similar results.
These insights are, however, a snapshot of the current situation and cannot be interpreted causally. In the face of an external shock to supply, reduced access to cash could increase the likelihood of people adopting digital payment tools. We were able to isolate this causal effect using the instrumental variable approach and exploiting the pandemic as a natural experiment. In particular, a random subset of individuals experiencing limited cash access during the pandemic was more likely to shift perceptions of physical banking presence, which in turn nudged some towards adopting digital payments more often. This shows that, while the less digitalised group perceives as much physical banking presence as the rest of the population as shown in the main text, a supply restriction from the retail banking sector (particularly on access to cash) could force some individuals to adopt debit or credit cards and payment accounts more often.
Recent literature highlights that despite the growth of e-commerce, physical stores are set to remain relevant in the future. Physical stores are adapting to offer unique sensory experiences not replicable online and increasingly embrace omnichannel trends, where physical stores expand online and online outlets establish a physical presence. This trend, seen especially in smaller stores and areas with significant customer footfall, positions bricks-and-mortar stores as hubs for customer engagement and experiential retail. The diversity of consumer preferences, as documented in our article, might be a reason why online and offline shopping options (and hence physical payments) will retain relevance in the future. See von Briel, F., “The future of omnichannel retail: A four-stage Delphi study”, Technological Forecasting and Social Change, Vol. 132, 2018, pp. 217-229, and Reinartz, W., Wiegand, N. and Imschloss, M., “The impact of digital transformation on the retailing value chain”, International Journal of Research in Marketing, Vol. 36, No 3, 2019, pp. 350-366.
For more on motivations to hold cash in CESEE countries, see Stix, H., “Why do people save in cash? Distrust, memories of banking crises, weak institutions and dollarization”, Journal of Banking and Finance, Vol. 37, No 11, 2013, pp. 4087-4106. For more on motivations to hold euro cash in CESEE, see Backé, P. and Beckmann, E., “Euro adoption in CESEE: How do financial literacy and trust in institutions affect people’s attitudes”, OeNB Focus on European Economic Integration, Q1, 2022.
The sample covers six EU Member States (Bulgaria, the Czech Republic, Croatia, Hungary, Poland and Romania) and four non-EU countries (Albania, Bosnia and Herzegovina, North Macedonia and Serbia). The data used refer to 2021, before Croatia joined the euro area, and reported results are consistent with previous years.
See European Central Bank, “The Eurosystem cash strategy”.
See footnote 23.
See the article entitled “The Eurosystem policy response to developments in retail payments”, Economic Bulletin, Issue 1, ECB, 2024. Exploring options for introducing a digital euro is part of this broader strategy, aimed at enhancing consumer choice in a changing payments environment and complementing rather than substituting cash. See European Central Bank, “Digital euro”.