
Assessing bank lending to corporates in the euro area since 2014
Published as part of the ECB Economic Bulletin, Issue 1/2020.
1 Introduction
Bank lending is the most important source of external finance for euro area firms and is therefore crucial for the transmission of monetary policy and, more generally, supporting economic growth. Despite the increasing relevance of non-bank financing over the last decade, bank lending remains a key element in the financing of euro area corporates. In particular, bank loans accounted for around 45% of total non-financial corporation (NFC) debt financing in 2018, down from around 60% in 2007.[2] During this period, credit markets were subject to multiple sources of stress, with the banking sector and its intermediation capacity being particularly affected. As a result, it has become even more essential from a central bank perspective to carry out careful analysis of bank lending.
This article provides an assessment of the recovery in lending to NFCs observed in the euro area since 2014.[3] It focuses on two main aspects of this assessment.
First, the article shows that, following the period of adjustment of bank balance sheets in 2008-13, improving bank credit supply conditions have supported the growth in corporates’ business investment. More ample credit supply has thus complemented the stronger demand for credit, which in turn reflected improvements in the macroeconomic outlook, corporate balance sheets and corporate profitability. At the same time, the strength of the relationship between business investment and bank lending to corporates has differed across the major euro area countries, owing in part to the varying use of alternative sources of financing and different deleveraging needs.
Second, the article provides evidence that the recovery in NFC lending has been supported by the ECB’s monetary policy measures. This evidence includes quantitative model-based estimates together with survey-based information. This analysis is complemented by a forward-looking assessment suggesting that the new series of targeted longer-term refinancing operations (TLTRO III) will help to preserve favourable bank lending conditions, ensure the smooth transmission of monetary policy and further support the accommodative stance of monetary policy.
2 The recovery in bank lending to corporates
Bank lending to euro area corporates has gradually recovered since 2014, broadly in line with economic activity, although growth remains below pre-crisis levels. Annual growth in loans to NFCs, which had reached a trough in early 2014, returned to positive territory in 2015 and increased gradually thereafter, peaking at 4.3% in September 2018. It has stabilised at around 3.5-4% in recent quarters, reflecting the slowdown in real economic activity observed during 2018.[4] Overall, the recovery in bank lending to firms since 2014 has been rather moderate, with current growth rates remaining well below pre-crisis levels, despite very favourable financing conditions in particular since the ECB adopted non-standard monetary policy measures in 2014.[5] Evidence based on a Bayesian vector autoregression (VAR) model suggests that the pattern of the recovery since 2014 has been broadly in line with macroeconomic developments, given past business cycle regularities (Chart 1), although it tends to be at the lower end of the estimated confidence band. This assessment is based on a comparison between actual loan growth and what should have been expected taking the observed main macroeconomic variables in the recovery period as given and assuming that the relationship between bank lending and economic activity has not fundamentally changed over the past twenty years.
Chart 1
Bank loans to NFCs (actual and conditional forecast) and real GDP
(annual percentage changes)
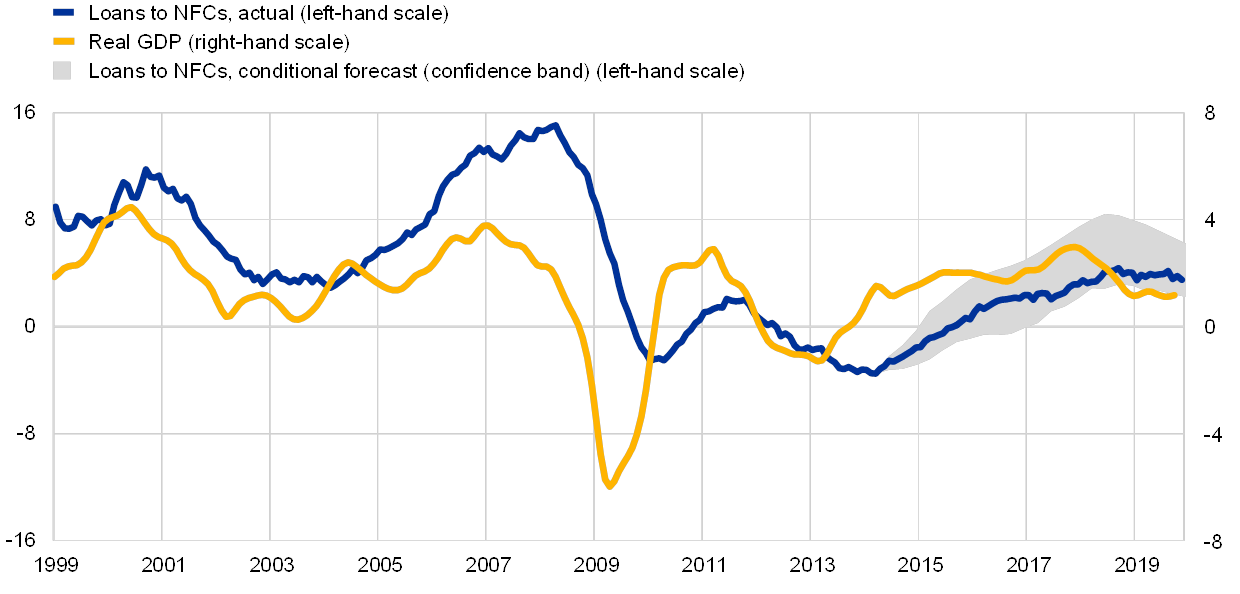
Sources: ECB and ECB calculations.
Notes: Bank loans to NFCs are adjusted for sales, securitisation and cash pooling activities. The model used in the simulations is a Bayesian VAR model estimated in levels from the first quarter of 1995 to the first quarter of 2014 including six real and financial variables at quarterly frequency for the euro area: real GDP, the GDP deflator, bank loans to NFCs, the short-term interest rate, the ten-year sovereign bond yield and the lending rate to NFCs. The grey area includes the 16th and 84th percentiles of the forecast conditional on the actual developments in real GDP and the GDP deflator from the second quarter of 2014 to the second quarter of 2019. For more details on the modelling approach, see Giannone, D., Lenza, M. and Primiceri, G.E., “Prior Selection for Vector Autoregressions”, The Review of Economics and Statistics, Vol. 97, Issue 2, May 2015, pp. 436-451 and Altavilla, C., Giannone, D. and Lenza, M., “The financial and macroeconomic effects of the OMT announcements”, International Journal of Central Banking, Vol. 12, No 3, September 2016. Quarterly real GDP growth interpolated to monthly frequency using a cubic spline function. The latest observations are for November 2019 for loans and the third quarter of 2019 for real GDP.
The overall moderate pace of the recovery in NFC bank lending since 2014 mainly reflects the post-crisis deleveraging process and the growing relevance of alternative sources of finance. While receiving strong support from the ECB’s non-standard monetary policy measures (see Section 4 of this article), bank lending to corporates since 2014 has been restrained by at least three factors, with a number of demand factors playing a role. First, loan growth dynamics during the recovery have reflected the somewhat weaker economic activity compared with pre-crisis levels (Chart 1).[6] Second, the strong balance sheet adjustment process affecting borrowers in the post-crisis period (Chart 2) has weighed on the demand for bank loans in some countries more than others. Bank borrowing has mainly been weaker in sectors whose indebtedness increased the most during the pre-crisis boom, such as construction.[7] In a context of strong deleveraging needs, the ample availability of internal funding, as evidenced by the significant increase in retained earnings and liquid asset holdings recorded after the financial crisis, has also dampened the demand for bank loans in recent years.[8] Third, since the crisis firms have increasingly met their financing needs from alternative sources of external funding, mostly by issuing corporate bonds. Corporate bond issuance has become a more important source of funds for euro area firms (Chart 3), particularly for large corporates: initially (2009-10 and 2012-14) as a substitute for bank borrowing, reflecting a significant decline in the relative cost of market-based debt (Chart 4) and restrictions in bank credit supply, and subsequently as a complementary source of finance to bank loans, in particular after the ECB launched its corporate sector purchase programme (CSPP) in 2016.
A conclusive assessment of the factors behind the moderate pace of the recovery in bank lending to corporates requires a careful analysis of credit supply forces. For instance, given the endogeneity of both lending and economic activity, it would be possible to conclude that the latter has been constrained by the lack of bank financing. By the same token, resorting to other sources of finance could be the result of concerns about the ability to access bank loans, and would be indicative of supply-side constraints. The next section provides some evidence that helps to distinguish between these competing interpretations.
Chart 2
NFC consolidated gross debt in selected euro area countries
(as a share of NFC gross value added, %)
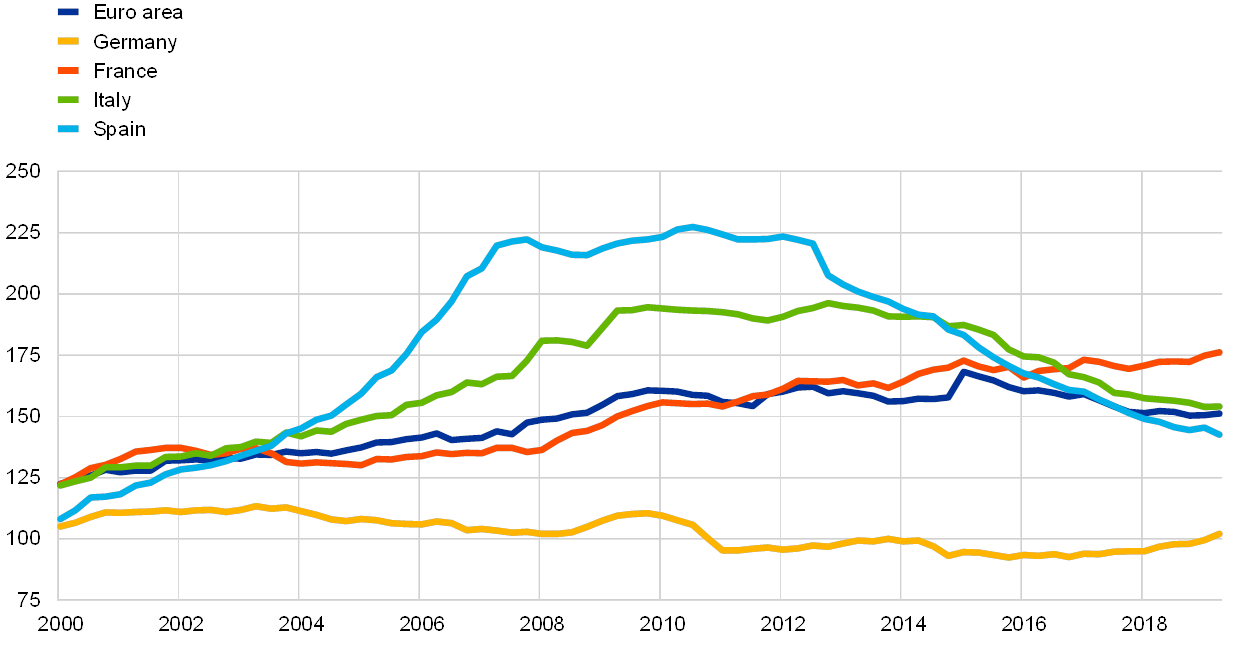
Sources: Eurostat, ECB and ECB calculations.
Note: The latest observation is for the second quarter of 2019.
Chart 3
Development of bank loans to NFCs and corporate bond issuance
(annual flows, EUR billions)
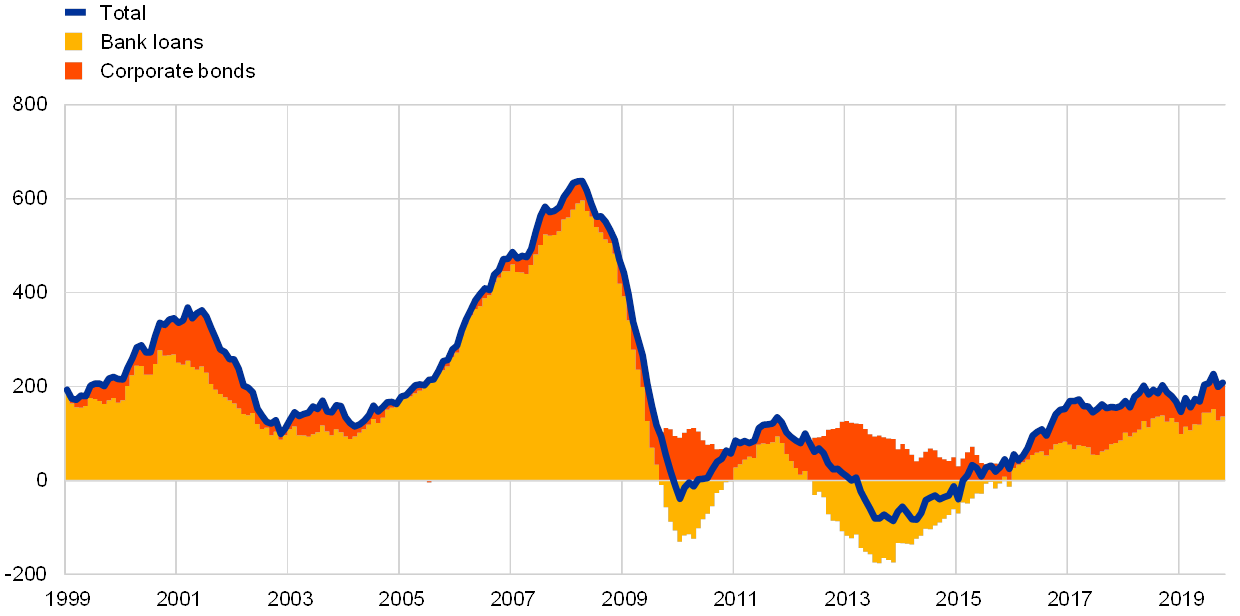
Source: ECB.
Note: The latest observation is for October 2019.
Chart 4
Ratio of debt securities issuance to bank loans and relative cost of market-based debt
(left-hand scale: ratio based on notional stocks; right-hand scale: percentage points)

Sources: Merrill Lynch, ECB and ECB calculations.
Note: The latest observation is for the second quarter of 2019.
3 Support for economic activity
Credit supply conditions have supported corporates’ business investment. A range of models show that credit supply conditions (i.e. the availability of bank credit), which depressed business investment growth during the economic downturn, have been supporting business investment in the post-2014 recovery phase. According to these analyses, credit supply conditions have boosted business investment growth by about 1 percentage point on average over the recovery phase that started in 2014 (Chart 5). Replies to surveys by both lenders and borrowers support this view. According to the ECB’s bank lending survey (BLS), which provides information on loan demand and the credit standards applied by banks, an unprecedentedly long period of easing credit conditions has been observed since the beginning of 2014.[9] The implementation of a number of non-standard monetary policy measures turns out to be a significant factor supporting easing of supply, as discussed in Section 4 of this article. A similar view can be drawn from the Survey on the Access to Finance of Enterprises (SAFE), which covers a very large sample of euro area firms. This shows that the availability of bank loans has improved considerably over the recovery phase.[10]
Chart 5
Estimated impact of credit supply factors on business investment growth
(percentage point contributions to annual percentage changes)

Source: ECB calculations.
Notes: Estimated contributions of credit supply factors to annual growth rate of business investment based on a suite of models (time-varying parameter VAR with stochastic volatility with sign restriction identification: Gambetti, L. and Musso, A., “Loan supply shocks and the business cycle”, Journal of Applied Econometrics, Vol. 32, Issue 4, June/July 2017; Bayesian VAR with sign restriction identification; proxy-SVAR: Altavilla, C., Darracq Pariès, M. and Nicoletti, G., “Loan supply, credit markets and the euro area financial crisis”, Journal of Banking & Finance, Vol. 109, 2019). The latest observation is for the second quarter of 2019.
Longer-term loans, typically linked to fixed capital and financial investment, have driven the recovery in bank lending to corporates since 2014. Loans with longer maturities have accounted for most of the lending growth to NFCs during the recovery, proving more dynamic than short-term loans (Chart 6). This is in clear contrast to the pre-crisis boom, when short-term lending accounted for more than a quarter of total bank lending to NFCs. The shift towards longer maturities has been favoured by both the flattening and the downward shift of the yield curve, driven to a significant extent by the ECB’s monetary policy, which has supported the demand for long-term fixed rate loans.[11] Long-term loans contribute to economic growth in two ways. First, they reduce firms’ rollover and cash flow stress. Second, and more importantly, firms tend to have a preference for matching the maturity of their assets and liabilities, meaning that an abundance of long-term financing makes it easier for them to engage in long-term projects. In this respect, the solid growth in fixed investment seen in recent years is consistent with the increased relevance of long-term bank lending. Long-term lending has also favoured financial activities of a structural nature, such as M&A, the magnitude of which has contributed to the recent dynamism observed in syndicated loans.[12]
Chart 6
Bank loans to NFCs by maturity
(annual percentage changes)

Sources: ECB and ECB calculations.
Notes: Breakdown by maturity based on unadjusted loans. The latest observation is for November 2019.
Survey evidence confirms the importance of business investment for the demand for bank loans. According to the BLS, the demand for bank loans to euro area enterprises since 2014 has been supported by the funding that corporates need for fixed investment.[13] Beyond this, M&A activity has also contributed to the growth in demand during the same period. The SAFE confirms that enterprises have mainly used the finance they have continued to obtain primarily from bank loans for fixed investment during the recovery.[14]
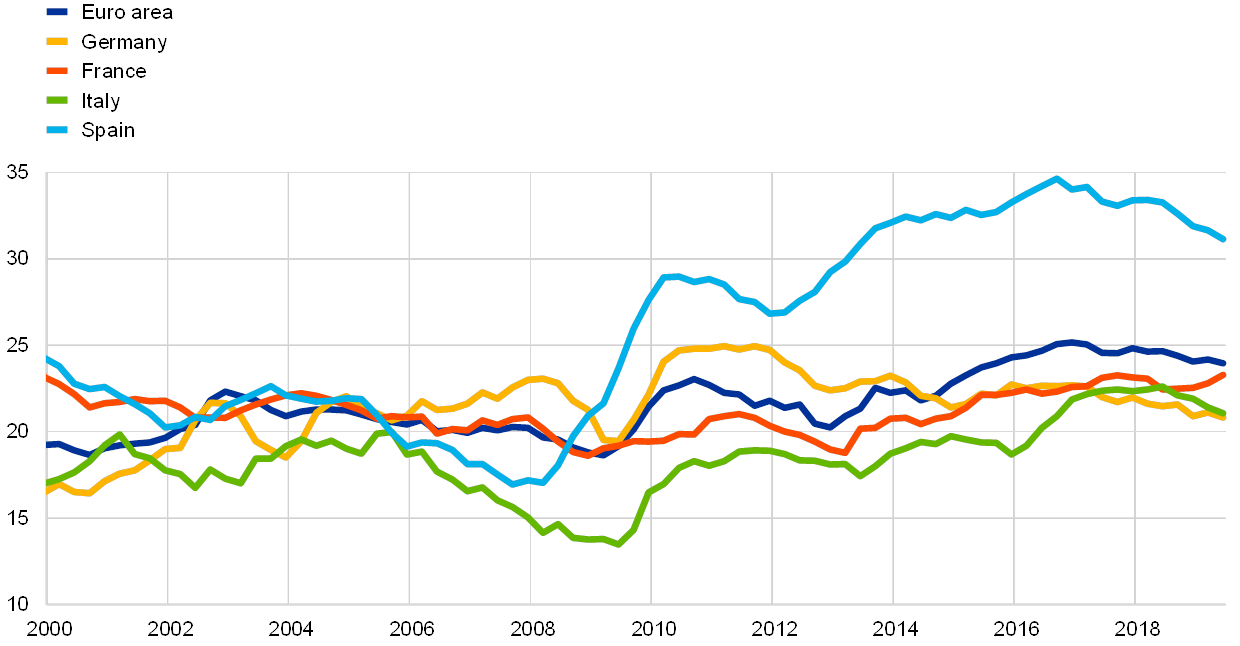
The strength of the relationship between business investment and bank lending to corporates has, however, differed across countries. Business investment has been growing at similar rates across the large euro area countries since 2014 (see panel (a) in Chart 7).[15] However, the growth in lending to NFCs has increasingly diverged in the large euro area economies as the recovery at the euro area level has matured, with Germany and France enjoying steadily increasing growth rates and Italy and Spain hovering around or below the zero line since 2016 (see panel (b) in Chart 7). Bank lending to corporates has developed in line with business investment in Germany and France[16] whereas a sizeable gap can be observed in Spain in particular and also Italy. In Germany and France, the recovery in bank lending to corporates has also been supported by dynamic real estate sectors and the need to finance M&A activities. In addition, in Germany, corporate indebtedness has remained particularly low, allowing firms to easily expand their recourse to external financing. In Italy and Spain, the gap between business investment and bank lending can be explained mainly by the severe deleveraging process undertaken by firms in recent years, which has been very pronounced for Spain, and by the use of alternative sources of finance. Indeed, there is a link between the accumulation of retained earnings (Chart 8), and hence the availability of internal funding, and the deleveraging imperative, which has continued to weigh on the demand for loans in both countries, especially from firms in the real estate and construction sectors. These sectors in particular have exercised a significant drag on total loan growth in Spain and Italy during the recovery phase.[17] In addition, the issuance of debt securities by firms has grown in both Italy and Spain since 2017, in clear contrast to previous recoveries (Chart 9). Moreover, the banking sector in both countries has gone through a process of significant balance sheet adjustment in recent years, which has constrained bank intermediation capacity during the process.[18] Despite gradual improvements since 2014, in Italy the stock of non-performing loans remains particularly high, which affects the capacity of banks to supply credit.
Chart 7
Business investment and bank loans to NFCs in selected euro area countries
(panel (a): annual percentage changes, four-quarter moving average; panel (b): annual percentage changes)

Sources: Eurostat, ECB and ECB calculations.
Notes: Business investment refers to private non-residential investment. Bank loans to NFCs are adjusted for sales, securitisation and cash pooling activities. The latest observations are for the second quarter of 2019 for business investment and November 2019 for loans.
Chart 8
Retained earnings in selected euro area countries
(as a share of gross value added, %)
Source: Eurostat.
Note: The latest observation is for the second quarter of 2019.
Chart 9
Development of bank loans to NFCs and corporate bond issuance in selected euro area countries
(annual flows, EUR billions)

Source: ECB.
Note: The latest observation is for October 2019.
4 The impact of non-standard monetary policy measures
Credit markets have benefited from multiple and complementary monetary policy measures pursued by the ECB since 2014. The ECB has adopted a number of non-standard monetary policy measures since the summer of 2014. This includes launching targeted longer-term refinancing operations (TLTROs), lowering the deposit facility rate (DFR) into negative territory and expanding the asset purchase programme (APP) to target a variety of investment-grade private and public sector securities. These policies have also been underpinned by forward guidance on the key ECB interest rates and, more recently, the reinvestment horizon for the APP portfolio and the resumption of the APP. The ECB’s measures have stimulated the euro area economy via a number of transmission channels, leading to a significant upward impact on both real GDP and HICP inflation.[19] The transmission of these measures has operated in part through credit markets, including the direct pass-through channel and the bank lending channel.[20] Overall, these monetary policies have supported both the demand for, and the supply of, bank lending to corporates by improving the macroeconomic outlook and helping to mitigate banking sector constraints. This assessment is supported by analyses based on macroeconomic models, survey-based evidence and empirical studies based on micro data.
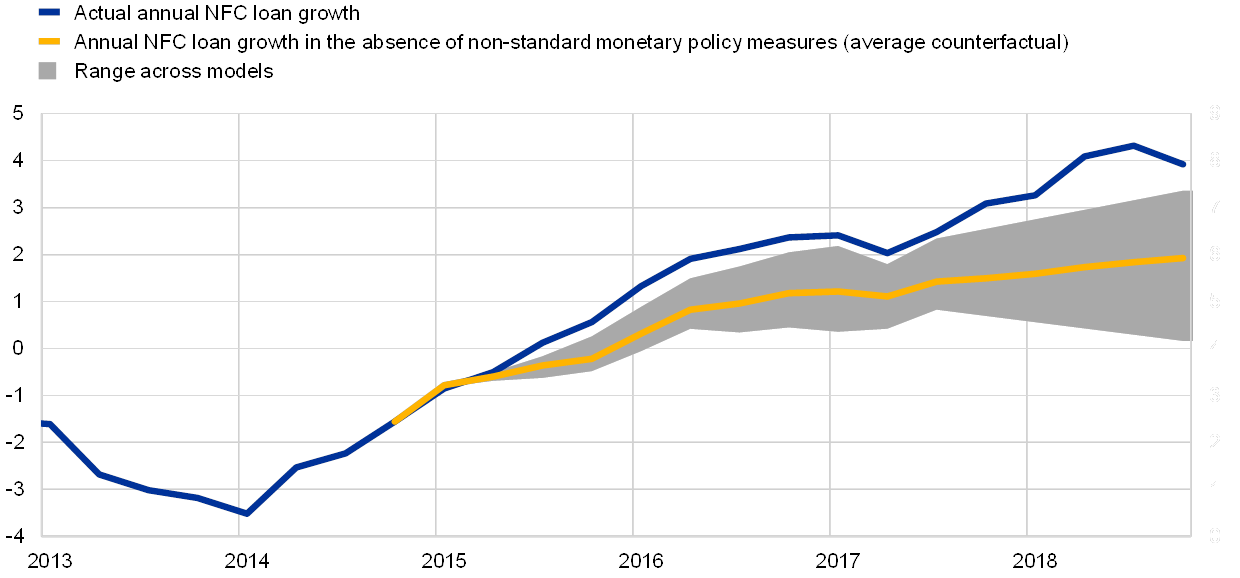
Model-based estimates at the macro level suggest that non-standard measures have significantly supported the recovery in bank lending to corporates. Simulations based on alternative macroeconomic models suggest that, in the absence of the ECB’s monetary policy measures, NFC loan growth would have recovered more slowly.[21] More specifically, while the growth of bank lending to corporates rose from about -1% in early 2015 to about 4% by the end of 2018, these model-based estimates suggest that, on average, annual loan growth would only have reached levels close to 2% by the end of 2018 if the ECB had not introduced its non-standard monetary policy measures (Chart 10). In other words, these measures are estimated to have induced about 2 percentage points of NFC loan growth between early 2015 and end-2018, affecting both demand and supply factors.
Chart 10
Estimated impact of non-standard measures on NFC loan growth
(annual percentage changes)
Sources: ECB and ECB calculations.
Notes: These simulations are based on a DSGE model, a VAR with time-varying parameters and stochastic volatility and a multi-country Bayesian VAR. For more details on the models used, see Darracq Pariès, M., Drahonsky, A.C., Falagiarda, M. and Musso, A., op. cit. The latest observation is for the fourth quarter of 2018.
Survey-based evidence supports the view that the ECB’s measures have had a tangible impact on bank lending conditions. Qualitative evidence on the relevance of the ECB’s non-standard measures can be obtained from indicators derived from the BLS. A number of ad hoc questions included in the survey since 2015 have made it possible to compile a synthetic view of how banks perceive the effect of recent ECB non-standard measures, such as the TLTROs, a negative DFR and the APP, on their financial situation and lending decisions. The replies to these questions indicate that these measures have had a favourable impact on banks’ liquidity and market financing conditions. Moreover, the survey responses suggest that the ECB’s measures have had a substantial net easing impact on banks’ terms and conditions, while the effects on their credit standards have been more limited.[22]
Studies based on granular banking and firm-level data suggest that the impact of the ECB’s non-standard monetary policy measures on credit markets has operated via various channels. With regard to the TLTROs, some evidence suggests that, in combination with the other non-standard measures introduced since June 2014, the first two series of operations have proven effective in supporting the transmission of lower policy rates into improved borrowing conditions for corporates in the euro area. Moreover, these operations appear to have supported higher intermediation volumes in less vulnerable euro area countries and a slowdown of the contraction in bank lending in vulnerable countries.[23] Concerning the third series of such operations, Box 1 provides an overview of its modalities and the development of banks’ funding conditions in the wake of its announcement.
The introduction of a negative DFR in mid-2014 has provided an additional incentive for banks to lend to NFCs by increasing the opportunity cost of holding excess liquidity. As such, a negative DFR has provided an effective foil to the APP by increasing the cost of holding the reserves injected by the ECB’s large-scale purchase programme. This has given banks an incentive to rebalance towards other assets, notably loans, thereby boosting credit supply.[24] Although this impact was broad-based, it was not evenly spread across banks, and some evidence suggests that it was stronger for universal banks and for banks with higher holdings of sovereign bond.
Box 1The new series of quarterly targeted longer-term refinancing operations: impact on funding costs and transmission
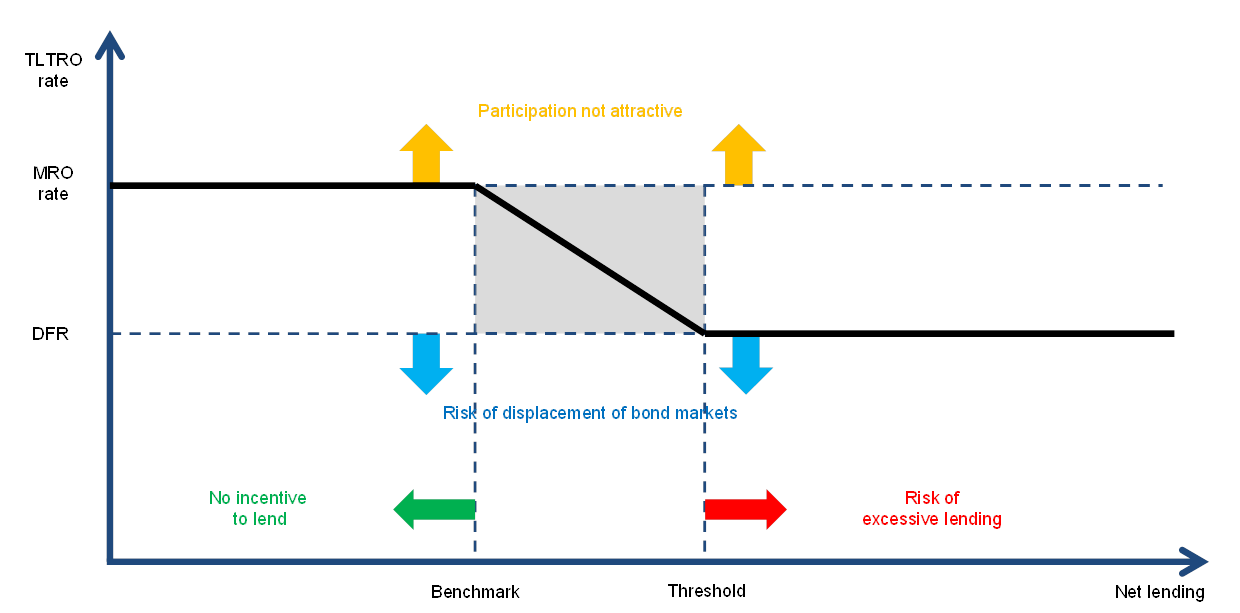
The new series of quarterly targeted longer-term refinancing operations (TLTRO III) that started in September 2019 contains incentives for banks to maintain favourable lending conditions to the real economy. Similarly to TLTRO II, the new series features rewards, in the form of lower interest rates, for banks that extend eligible loans to firms and households.[25] The maximum rate is fixed at the level of the main refinancing operations (MRO) rate. By contrast, the rate applied to TLTRO III for counterparties whose eligible net lending between the end of March 2019 and the end of March 2021 exceeds their benchmark net lending will benefit from a reduction that can bring it to a level as low as the deposit facility rate (DFR) (currently -50 basis points).[26] Two main parameters define the incentive scheme: the width and position of the range of interest rates that are applied, and the amount by which lending needs to exceed the benchmark to attain the lowest possible rate (Chart A). In terms of the rates, a higher maximum rate would have made it unattractive to participate in the operation, leading to low uptake and an unwarranted broader tightening of bank funding conditions. At the same time, the minimum achievable rate had to be calibrated in such a way as to provide the desired accommodation and simultaneously avoid banks being completely discouraged from obtaining funding by issuing debt securities in private markets. Turning to the lending performance requirement, the lending threshold provides the target required to induce sufficient eligible bank lending, while its rather moderate level avoids triggering predatory behaviour by intermediaries that could result in large loan exposures and excessive risk-taking. These main parameters are flanked by additional features that also help to achieve the aims of TLTRO III. In particular, unwanted uses of the funds borrowed (i.e. acquiring assets rather than extending eligible loans) are further restrained by borrowing allowances that limit the scope for additional borrowing, given the amounts already obtained under TLTRO II. Moreover, the indexation of TLTRO III pricing links it to that of alternative and comparable funding instruments, thus not discouraging banks from obtaining funding by issuing debt in private markets as TLTRO III unfold.
Chart A
Illustration of the TLTRO III incentive scheme
(percentages per annum)
Source: ECB.
Notes: The chart provides an illustration of the borrowing rate for TLTRO III. MRO and DFR refer to the average rates prevailing over the life of each operation. The grey area identifies the region in the parameter space that is compatible with the aim and limitations of the programme.
The announcement of TLTRO III in March 2019 reassured markets about the extension of a longer-term funding facility and alleviated the funding pressure on banks. The new operations helped to stave off “congestion effects” that would materialise in bank funding markets owing to the concurrent need to replace expiring TLTRO II funds and large volumes of maturing bonds (Chart B). Such congestion effects would have pushed up bank bond spreads, affecting funding costs not only for banks that had borrowed under TLTRO II but also for other banks. Indeed, according to the ECB’s bank lending survey (BLS), banks have reported a net easing of market conditions since the new programme was announced, especially for debt securities funding.[27] Although this change partly reflected the reversal of the widening in credit spreads following the risk-aversion episode at the end of 2018, it also occurred despite the worsening of the macroeconomic outlook and the increase in uncertainty throughout 2019, circumstances that could have otherwise prompted a deterioration in banks’ access to funding.
Chart B
TLTRO II and bond market refinancing needs of euro area banks
(EUR billions)

Sources: ECB and CSDB.
Notes: Long-term bond redemptions include bonds with an original maturity of more than a year, obtained from the CSDB statistics extracted as of October 2019. Hybrid bonds, certificates and Genussscheine are not considered in the calculation. Maturing TLTRO II funds refer to outstanding TLTRO II volumes (as of September 2019). TLTRO II.1, TLTRO II.2, TLTRO II.3 and TLTRO II.4 mature in June 2020, September 2020, December 2020 and March 2021 respectively.
In September 2019 the Governing Council decided to adjust the pricing and the maturity of TLTRO III against the background of a more protracted slowdown in the euro area economy than previously anticipated.[28] The new modalities adopted in September 2019 will preserve favourable bank lending conditions, ensure the smooth transmission of monetary policy and further support the accommodative stance of monetary policy.[29] The additional accommodation is expected to be transmitted via an overall compression of bank funding costs and a higher uptake of TLTRO III funds. Direct funding cost relief will be provided to banks that shift their funding choices away from more expensive bond funding options, while the overall decrease in the supply of securities induced by the lower funding needs of banks will exert further pressure on remaining market bond yields. As a consequence, the bank lending channel will lead to lower lending rates and higher credit volumes, as the experience of previous TLTROs shows.[30] Using a suite of models estimated on euro area data, the latest expectations of market participants for TLTRO III uptake as reported in surveys, which range between €300 billion and €560 billion, can be mapped to an overall funding cost relief of around 15 basis points. This in turn would be expected to lead to a peak reduction in lending rates of 15 basis points and a positive contribution to annual loan growth of almost 0.4 percentage points (Chart C).
Chart C
Impact of TLTRO III uptake on lending rates and volumes expected by market participants
(panel (a), percentage points per annum; panel (b), percentage point contribution to annual growth rate)

Sources: Bloomberg survey (October 2019), ECB and ECB calculations.
Notes: The assessment assumes a decrease in the marginal funding costs driven by partial substitution with lower issuance of bank bonds. The estimates are based on a range of models including those described in Altavilla, C., Canova, F. and Ciccarelli, M., “Mending the broken link: Heterogeneous bank lending rates and monetary policy pass-through”, Journal of Monetary Economics, 2019; Holton, S. and Rodriguez D’Acri, C., “Interest rate pass-through since the euro area crisis”, Journal of Banking & Finance, Vol. 96, Issue C, 2018, pp. 277-291; Benetton, M. and Fantino, D., “Competition and the pass-through of unconventional monetary policy: evidence from TLTROs”, Working Papers, No 1187, Banca d’Italia, 2018; Albertazzi, U., Altavilla, C., Boucinha, M. and Di Maggio, M., “The incentive channel of monetary policy: quasi-experimental evidence from liquidity operations”, mimeo, 2019. The TLTRO III uptake underlying the median is the median expectation by market participants according to the Bloomberg survey. Areas shaded dark blue denote the interquartile range of model-based outcomes for the median uptake expectation.
5 Concluding remarks
This article provides an assessment of the recovery in bank lending to euro area firms observed since 2014. Evidence reported in the article shows that loan growth has remained below pre-crisis levels during the recovery. While supported by highly favourable financing conditions, the moderate pace of the recovery has mainly reflected the post-crisis deleveraging process and the growing relevance of alternative sources of finance, as well as somewhat weaker economic activity compared with the pre-crisis period.
Improving credit supply conditions have supported the growth of credit and hence the expansion in firms’ business investment. The positive effect of credit supply factors has reinforced the impact of a gradual normalisation in credit demand, which reflects improvements in the macroeconomic outlook and corporate balance sheets. The strength of the relationship between business investment and bank lending to corporates has, however, differed across countries. This heterogeneity is explained in part by the varying relevance of the use of alternative sources of finance across countries, the differing levels of deleveraging needs and country-specific macroeconomic developments.
Finally, ample evidence indicates that the recovery in bank lending to corporates would have been significantly weaker in the absence of the monetary policy measures pursued by the ECB since the summer of 2014. More specifically, model-based estimates at the macro level, survey-based evidence and studies based on granular banking and corporate data all suggest that the ECB’s non-standard measures have accounted for a significant portion of the recovery in bank lending to corporates. A forward-looking assessment suggests that TLTRO III will help to preserve favourable bank lending conditions, ensure the smooth transmission of monetary policy and further support the accommodative stance of monetary policy.
- Data support provided by Filippo Claps and Franziska Fischer.
- For more details on the factors underlying this trend, see “The structural dimension of the financing of non-financial corporations and households in the euro area”, Annual Report, ECB, Frankfurt am Main, 2017.
- For an analysis of bank loan developments before 2014, see “Extensions to the models for assessing money and credit”, Monthly Bulletin, ECB, Frankfurt am Main, February 2014, “Money and credit growth after economic and financial crises – a historical global perspective”, Monthly Bulletin, ECB, Frankfurt am Main, February 2012 and “Recent developments in loans to the private sector”, Monthly Bulletin, ECB, Frankfurt am Main, January 2011.
- NFC loan growth typically lags the business cycle by about three to four quarters. For more details on the cyclical properties of bank loans, see Darracq Pariès, M., Drahonsky, A-C., Falagiarda, M. and Musso, A., “Macroeconomic analysis of bank lending for monetary policy purposes”, Occasional Paper Series, forthcoming, ECB, Frankfurt am Main.
- As shown in Chart 12 in Section 5 of this issue of the Economic Bulletin (“Money and credit”), the cost of bank borrowing has declined significantly for NFCs since 2014, reaching record lows in recent quarters.
- The average annual growth rate of real GDP was 2.3% between 1999 and 2007 and 1.9% between 2014 and 2019.
- For more details on recent sectoral loan developments, see Darracq Pariès, M., Drahonsky, A-C., Falagiarda, M. and Musso, A., op. cit.
- See also the Financial Stability Review, ECB, Frankfurt am Main, May 2019.
- For more details, see Köhler-Ulbrich, P., Hempell, H.S. and Scopel, S., “The euro area bank lending survey”, Occasional Paper Series, No 179, ECB, Frankfurt am Main, September 2016 and Burlon, L., Dimou, M., Drahonsky, A. and Köhler-Ulbrich, P., “What does the bank lending survey tell us about credit conditions for euro area firms?”, Economic Bulletin, Issue 8, ECB, Frankfurt am Main, 2019.
- For more details, see Chart 15 in the “Survey on the Access to Finance of Enterprises in the euro area”, ECB, Frankfurt am Main, November 2019.
- In particular, bank lending rates for short-term loans (fixation period of up to one year) declined by around 140 basis points between January 2014 and September 2019, while rates for long-term loans (fixation period of over one year) declined by around 180 basis points over the same period.
- For more details on recent developments in syndicated lending, see Darracq Pariès, M., Drahonsky, A-C., Falagiarda, M. and Musso, A., op. cit.
- For more details, see Köhler-Ulbrich, P., Hempell, H.S. and Scopel, S., op. cit. and Burlon, L., Dimou, M., Drahonsky, A. and Köhler-Ulbrich, P., op. cit.
- For more details, see Chart 13 in the “Survey on the Access to Finance of Enterprises in the euro area”, ECB, Frankfurt am Main, November 2019.
- Business investment refers to private non-residential investment.
- In Germany, the recovery in bank lending has been accompanied by an increasing contribution of lending to firms in other euro area countries.
- For more details, see Darracq Pariès, M., Drahonsky, A-C., Falagiarda, M. and Musso, A., op. cit.
- For more details on recent bank balance sheet developments, see Altavilla, C., Andreeva, D., Boucinha, M. and Holton, S., “Monetary policy, credit institutions and the bank lending channel in the euro area”, Occasional Paper Series, No 222, ECB, Frankfurt am Main, May 2019.
- For an overview of the macroeconomic impact of the monetary policy measures adopted by the ECB since 2014, see Rostagno, M., Altavilla, C., Carboni, G., Lemke, W., Motto, R., Saint-Guilhem, A. and Yiangou, J., “A tale of two decades: the ECB’s monetary policy at 20”, Working Paper Series, No 2346, ECB, Frankfurt am Main, December 2019.
- For a discussion of the main transmission channels for the ECB’s credit easing package of 2014 and the APP starting in 2015, see ”The transmission of the ECB’s recent non-standard monetary policy measures”, Economic Bulletin, Issue 7, ECB, Frankfurt am Main, 2015.
- These simulations are based on a dynamic stochastic general equilibrium (DSGE) model for the euro area, a VAR with time-varying parameters and stochastic volatility (TV-VAR) for the euro area and a multi-country Bayesian VAR (BVAR) for euro area countries. DSGE simulations are based on Darracq Pariès, M. and Kühl, M., “The optimal conduct of central bank asset purchases”, Working Paper Series, No 1973, ECB, Frankfurt am Main, November 2016. TV-VAR estimates are based on Gambetti, L. and Musso, A., “The macroeconomic impact of the ECB's expanded asset purchase programme (APP)”, Working Paper Series, No 2075, ECB, Frankfurt am Main, June 2017. BVAR estimates are based on Altavilla, C., Giannone, D. and Lenza, M., “The financial and macroeconomic effects of the OMT announcements”, International Journal of Central Banking, Vol. 12, No 3, September 2016. For more details on the models used, see Darracq Pariès, M., Drahonsky, A-C., Falagiarda, M. and Musso, A., op. cit.
- For more details, see Burlon, L., Dimou, M., Drahonsky, A. and Köhler-Ulbrich, P., op. cit.
- For more details, see “The targeted longer-term refinancing operations: an overview of the take-up and their impact on bank intermediation”, Economic Bulletin, Issue 3, ECB, Frankfurt am Main, 2017. For the effects on lending rates, see “MFI lending rates: pass-through in the time of non-standard monetary policy”, Economic Bulletin, Issue 1, ECB, Frankfurt am Main, 2017 and “Impact of the ECB’s non-standard measures on financing conditions: taking stock of recent evidence”, Economic Bulletin, Issue 2, ECB, Frankfurt am Main, 2017.
- For a more detailed analysis, see Altavilla, C., Andreeva, D., Boucinha, M. and Holton, S., op. cit., Altavilla, C., Boucinha, M., Holton, S. and Ongena, S., “Credit supply and demand in unconventional times”, Working Paper Series, No 2202, ECB, Frankfurt am Main, November 2018 and Demiralp, S., Eisenschmidt, J. and Vlassopoulos, T., “Negative interest rates, excess liquidity and retail deposits: banks’ reaction to unconventional monetary policy in the euro area”, Working Paper Series, No 2283, ECB, Frankfurt am Main, May 2019.
- Eligible loans in the context of TLTRO III (as in the previous TLTROs) are loans to non-financial corporations and to households, excluding loans to households for house purchases.
- Benchmark net lending is the amount of eligible net lending (gross lending in the form of eligible loans net of repayments of outstanding amounts of eligible loans) that a participant needs to exceed in the period from 1 April 2019 to 31 March 2021 in order to qualify for an interest rate on the participant’s TLTRO III borrowing that is lower than the initial rate applied. It is equal to zero for banks that exhibited positive eligible net lending in the 12-month period to end-March 2019 and equal to the eligible net lending over the same period for banks that exhibited negative eligible net lending. This distinction removes potential disincentives to ongoing deleveraging efforts by participants. The maximum rate reduction is achieved when the benchmark net lending exceeds the threshold of 2.5% above the sum of the outstanding amounts of eligible loans as at 31 March 2019 and the benchmark net lending.
- See “The euro area bank lending survey – Third quarter of 2019”, ECB, Frankfurt am Main, October 2019.
- The pricing of TLTRO III was adjusted in September 2019 by removing the 10 basis points spread over the MRO and the DFR, while the maturity was extended from two years to three.
- See Schumacher, J. and Van Robays, I., “The September policy package”, Economic Bulletin, Issue 6, ECB, Frankfurt am Main, 2019.
- See “The targeted longer-term refinancing operations: an overview of the take-up and their impact on bank intermediation”, Economic Bulletin, Issue 3, ECB, Frankfurt am Main, 2017 and Altavilla, C., Andreeva, D., Boucinha, M. and Holton, S., op. cit.