
Euro area international investment position and its geographical breakdown at the end of 2011 and geographical breakdown of the current account up to the second quarter of 2012
The international investment position of the euro area vis-à-vis the rest of the world recorded net liabilities of €1.3 trillion (14% of euro area GDP) at the end of 2011, €52 billion more than at the end of 2010. This change was due mainly to negative revaluation effects as a result of other adjustments (€405 billion) and exchange rate changes (€30 billion).
At the end of 2011, 19% of the euro area’s stock of direct investment abroad was in the United Kingdom, and another 19% was in the United States, while these two countries’ shares in the stock of foreign direct investment in the euro area were somewhat larger (with 24% originating from the United Kingdom and another 24% from the United States). The portfolio investment assets of euro area residents mainly reflected holdings of securities issued in the United States (33%) and the United Kingdom (21%).
The international investment position as at end-2011
At the end of 2011, the international investment position (i.i.p.) of the euro area vis-à-vis the rest of the world recorded net liabilities of €1.3 trillion (14% of euro area GDP), €52 billion more than the revised end-2010 position, which also represented 14% of euro area GDP (see Chart 1a).

The slight increase in the net liability position from end-2010 to end-2011 was due mainly to negative revaluation effects stemming from other adjustments (€405 billion) and exchange rate changes (€30 billion), which were only partly offset by price changes (€337 billion), and net transactions (€45 billion; see Chart 1b). Compared with 2010, other adjustments and price changes had a far larger impact on the euro area’s net liability position, while exchange rate changes showed less of an impact and the effect of net transactions increased to some extent.
Net financial transactions were driven mainly by increases in net assets in direct investment (€155 billion) and other investment (€150 billion), together exceeding the increases in net liabilities in portfolio investment (€274 billion).
Revaluations reflecting price changes resulted in net price increases of €337 billion in 2011. These were mainly recorded in portfolio investment (€293 billion), reflecting the fact that the decreases of prices of non-euro area stock market indices were smaller than those of the euro area stock market indices. In addition, reserve assets reflected a price change of €61 billion, mainly related to the 19% increase seen in the price of gold.
Changes in outstanding amounts as a result of exchange rate changes (€30 billion) reflected the euro’s depreciation vis-à-vis other currencies in 2011 (e.g. its 3% depreciation against the US dollar and its 8% depreciation against the Japanese yen). In 2011, changes in the i.i.p. as a result of exchange rate developments were due mainly to the revaluation of foreign currency in portfolio investment (€22 billion) and other investment (€21 billion).
Other adjustments in portfolio investment mainly reflected a number of investment funds changing their place of residence to the euro area.

The geographical breakdown of the international investment position as at end-2011
At the end of 2011, the stock of euro area direct investment abroad totalled €5.6 trillion, of which 19% was invested in the United Kingdom, a further 19% in the United States, 9% in Switzerland, yet another 9% in offshore financial centres and 6% in other non-euro area EU Member States. The stock of foreign direct investment in the euro area totalled €4.4 trillion, with 24% from both the United States and the United Kingdom, 14% from offshore financial centres and 9% from Switzerland. Only 1% of foreign direct investment in the euro area came from other non-euro area EU Member States.
Compared with 2010, the shares of the euro area’s main partners have changed to a certain extent. Offshore financial centres are the largest group of net direct investors in the euro area (€147 billion), and other non-euro area EU Member States continued to be the largest group of net recipients of direct investment from the euro area (€274 billion). The stock of foreign direct investment from the United Kingdom decreased from 30% in 2010 to 24% at end 2011.
As regards portfolio investment, euro area holdings of foreign securities totalled €4.8 trillion at the end of 2011, largely reflecting holdings of securities issued in the United States (which accounted for 33% of the total), the United Kingdom (21%) and offshore financial centres (8%). Non-residents’ holdings of euro area securities totalled €7.6 trillion at the end of 2011.
Turning to other investment, euro area residents’ outstanding holdings abroad (e.g. loans to non-residents by euro area MFIs or deposits held by euro area residents with non-euro area MFIs) totalled €4.9 trillion at the end of 2011, of which 36% was in the United Kingdom, 16% in the United States and 12% in offshore financial centres. Other investment in the euro area (e.g. deposits held by non-residents with euro area MFIs or loans to euro area residents by non-euro area MFIs) totalled €5.1 trillion at the end of 2011, with the United Kingdom accounting for 38%, the United States for 14% and offshore financial centres for 10%.
The geographical breakdown of the four-quarter cumulated current account up to the second quarter of 2012
The four-quarter cumulated current account of the euro area up to the second quarter of 2012 showed a surplus of €55.0 billion (0.6% of euro area GDP), compared with a deficit of €3.7 billion a year earlier (see Table 3). This shift from deficit to surplus resulted mainly from increases in the surpluses for goods (from €3.7 billion to €51.4 billion) and services (from €58.3 billion to €79.6 billion), developments which were partly offset by an increase in the deficit for current transfers (from €107.6 billion to €114.7 billion) and, to a lesser extent, by a decrease in the surplus for income (from €41.8 billion to €38.8 billion).
The increase in the surplus of the goods account was due predominantly to a decrease (from €139.4 billion to €120.0 billion) in the deficit vis-à-vis “other countries” (particularly China, with the deficit vis-à-vis this country falling from €108.1 billion to €87.2 billion). Similarly, the increase in the surplus for services was due mainly to an increase (from €27.7 billion to €42.2 billion) in the surplus vis-à-vis “other countries”. The increase in the deficit for current transfers mainly reflected an increase (from €54.3 billion to €60.6 billion) in the deficit vis-à-vis EU institutions.
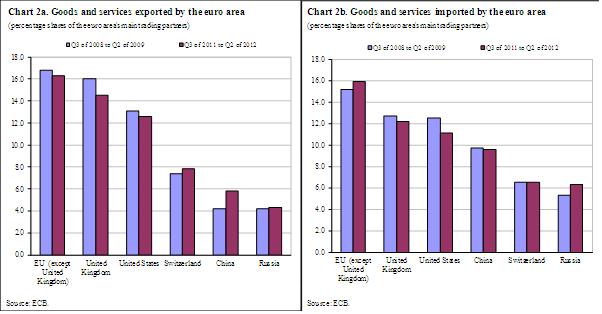
The four-quarter cumulated data up to the second quarter of 2012 revealed that non-euro area EU Member States (excluding the United Kingdom) represented the euro area’s primary trading partners, accounting for 16% of goods and services exported and imported by the euro area, followed by the United Kingdom and the United States (see Charts 2a and 2b).
Data revisions
This press release incorporates a revised set of balance of payments (b.o.p.) and international investment position statistics for the period 2009-2011 (see Table 4).
The revisions for the current account in 2011 mainly concerned the income account and resulted in the current account deficit (€2.3 billion) shifting by € 14.8 billion to a surplus (€ 12.5 billion).
In the financial account of the balance of payments, revisions primarily concerned direct investment in the euro area in 2009, portfolio investment liabilities and net other investment in 2010 and portfolio investment liabilities and financial derivatives in 2011.
In the i.i.p., the revisions for 2009 and 2010 resulted in an increase in the euro area’s net liability position. Finally, the euro area’s net liability position at end-2011 has likewise been revised upwards (by €230 billion) to stand at €1.3 trillion, higher than the figure previously published for the fourth quarter of 2011.
Additional information on the euro area’s balance of payments and international investment position
This press release breaks year-on-year changes in the international investment position down into valuation adjustments resulting from price changes, exchange rate changes and other adjustments (e.g. the reclassification of items, write-downs, changes in survey coverage and changes to companies’ places of residence). This breakdown is obtained by modelling non-transaction-related changes in the i.i.p. using information derived from the geographical breakdown and currency composition of assets and liabilities, as well as price indices for different financial assets.
Additionally, this press release breaks direct investment in equity down into investment in listed companies, investment in unlisted companies and investment in real estate. While direct investment in listed companies is valued on the basis of the market prices observed on stock exchanges, investment in unlisted companies is valued on the basis of the books of the companies being financed. For analytical purposes, listed companies’ valuation at book value is provided as a memorandum item, although it is not considered in the calculation of total direct investment.
A geographical breakdown of the euro area’s international investment position at end-2011 and the quarterly balance of payments is not available for portfolio investment liabilities, financial derivatives or reserve assetsIn addition, no separate data are provided for investment income payable to Brazil, China, India or Russia; furthermore, for offshore financial centres and international organisations, data are available only for the financial account.
In this press release, data for the current and financial accounts are not working day or seasonally adjusted.
A complete set of updated euro area balance of payments and international investment position statistics (including debt securities broken down by currency of denomination) is available in the “Statistics” section of the ECB’s website under the headings “Data services”/“Latest monetary, financial markets and balance of payments statistics”. These data, as well as historical time series for the euro area’s balance of payments and international investment position, can be downloaded from the ECB’s Statistical Data Warehouse (SDW). They will also be published in the November 2012 issues of the ECB’s Monthly Bulletin and Statistics Pocket Book. Detailed methodological notes are available on the ECB’s website. The next press release on the euro area’s monthly b.o.p. will be published on 16 November 2012.
Annexes
Table 1 – International investment position of the euro area, including a breakdown of changes from end-2010 to end-2011
Table 2a – Geographical breakdown of the euro area’s international investment position at end-2011
Table 2b – Geographical breakdown of the euro area’s international investment position at end-2010
Table 3 – Balance of payments of the euro area with a geographical breakdown
Table 4 – Revisions to the euro area’s balance of payments and international investment position
European Central Bank
Directorate General Communications
- Sonnemannstrasse 20
- 60314 Frankfurt am Main, Germany
- +49 69 1344 7455
- media@ecb.europa.eu
Reproduction is permitted provided that the source is acknowledged.
Media contacts