
Euro area balance of payments in February 2010 and international investment position at the end of 2009
In February 2010 the seasonally adjusted current account of the euro area recorded a deficit of EUR 3.9 billion. In the financial account, combined direct and portfolio investment recorded net inflows of EUR 11 billion (non-seasonally adjusted).
At the end of 2009, the international investment position of the euro area recorded net liabilities of EUR 1.5 trillion vis-à-vis the rest of the world (16% of euro area GDP). This represented a reduction of EUR 130 billion in comparison with the position at the end of the third quarter.
Balance of payments in February 2010
The seasonally adjusted current account of the euro area recorded a deficit of EUR 3.9 billion in February 2010 (see Table 1). This reflected deficits in current transfers (EUR 11.3 billion) and income (EUR 1.4 billion), which were partly counterbalanced by surpluses in goods (EUR 5.5 billion) and in services (EUR 3.2 billion).
The 12-month cumulated seasonally adjusted current account recorded a deficit of EUR 41.5 billion in February 2010 (around 0.4% of euro area GDP — see Chart 1), compared with a deficit of EUR 160.3 billion a year earlier. The reduction of the current account deficit was mainly due to a shift in goods from deficit (EUR 24.8 billion) to surplus (EUR 48.1 billion) and to decreases in the deficits in income (from EUR 72.9 billion to EUR 32.9 billion) and in current transfers (from EUR 99.3 billion to EUR 89.1 billion). Conversely, the surplus in services decreased (from EUR 36.6 billion to EUR 32.5 billion).
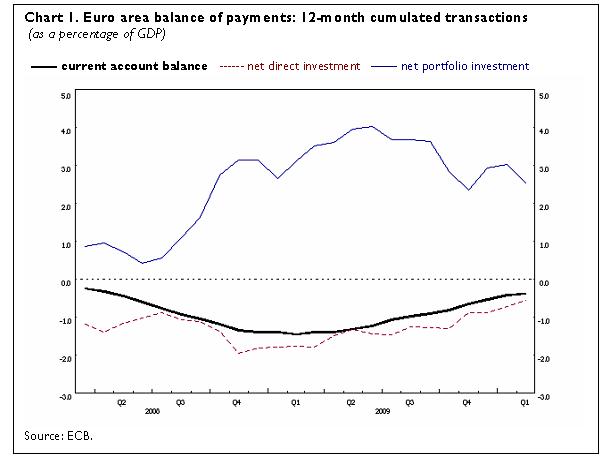
In the financial account (see Table 2), combined direct and portfolio investment recorded net inflows in February 2010 (EUR 11 billion), mainly related to portfolio investment (EUR 11 billion).
The direct investment account was balanced as net outflows in equity capital and reinvested earnings were offset by net inflows in other capital (mostly inter-company loans) (EUR 2 billion in both cases).
The net inflows in portfolio investment were predominantly accounted for by net inflows in debt instruments (EUR 9 billion), where net purchases of euro area instruments by non-residents (EUR 14 billion) exceeded the net purchases of foreign instruments by euro area residents (EUR 5 billion).
Financial derivatives recorded net outflows of EUR 1 billion.
The other investment account was close to balance, reflecting net inflows in MFIs excluding the Eurosystem (EUR 24 billion), general government (EUR 5 billion) and the Eurosystem (EUR 5 billion) that were offset by net outflows in other sectors (EUR 33 billion).
The Eurosystem’s stock of reserve assets was EUR 493 billion at the end of February 2010. Transactions in February 2010 contributed to an increase of EUR 4 billion in the overall position.
In the 12-month period to February 2010, combined direct and portfolio investment recorded cumulated net inflows of EUR 214 billion, compared with net inflows of EUR 149 billion in the preceding 12-month period. This increase was mainly the result of lower net outflows in direct investment (down from EUR 195 billion to EUR 62 billion), which were partly offset by lower net inflows in portfolio investment (down from EUR 344 billion to EUR 275 billion).
International investment position at the end of 2009
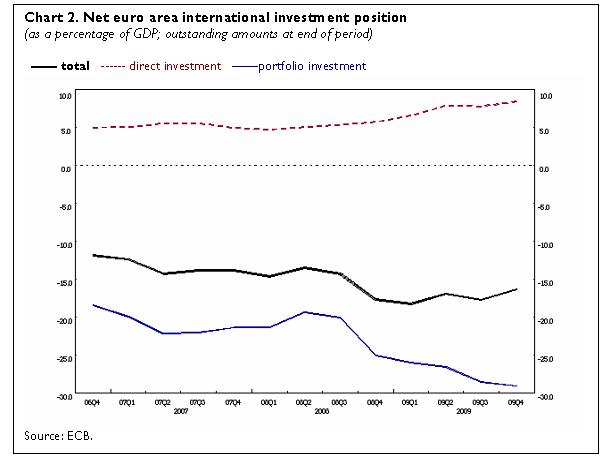
At the end of 2009, the international investment position of the euro area recorded net liabilities of EUR 1.5 trillion vis-à-vis the rest of the world (about 16% of euro area GDP — see Chart 2). This represented a reduction of EUR 130 billion in comparison with the revised data at the end of the third quarter (see Table 3).
The change in the net international investment position was mainly the result of a lower net liability position in other investment (from EUR 98 billion to EUR 26 billion), and higher net asset positions in direct investment (from EUR 697 billion to EUR 752 billion) and reserve assets (from EUR 431 billion to EUR 462 billion); these were partially compensated for by a higher net liability position in portfolio investment (from EUR 2 567 billion to EUR 2 608 billion). While the changes in the net position in portfolio and other investment were primarily driven by transactions, the changes in the reserve assets and direct investment positions were mainly driven by “other changes” (predominantly revaluations on account of exchange rate and asset price changes).
This press release for the first time includes data on the euro area’s gross external debt. The external debt statistics of the euro area represent debt liabilities of euro area residents owed to residents outside the euro area. At the end of 2009, the gross external debt of the euro area amounted to EUR 10.5 trillion (about 117% of euro area GDP), virtually the same amount as at the end of the third quarter of 2009 (see Table 3).
Data revisions
This press release incorporates revisions of the balance of payments for the period from January 2007 to January 2010, and of the international investment position for the period from the first quarter of 2009 to the third quarter of 2009.
The current account deficit in 2008 was revised from EUR 143.3 billion to EUR 153.8 billion, mainly owing to revisions in goods. Moreover, the revised data for 2009 show lower inflows in portfolio investment and higher inflows in financial derivatives. The revisions also affected the current account in January 2010, as the deficit was reduced from EUR 16.7 billion to EUR 14.7 billion, primarily on account of revisions in current transfers.
The revisions in the international investment position resulted in lower net asset positions in direct investment, and higher net liability positions in portfolio investment and other investment.
Additional information on the euro area balance of payments and international investment position
In this press release, the seasonally adjusted current account refers to working day and seasonally adjusted data. Data for the financial account are non-working day and non-seasonally adjusted.
In line with the agreed allocation of responsibilities, the European Central Bank compiles and disseminates monthly and quarterly b.o.p. statistics for the euro area, whereas the European Commission (Eurostat; see “Euro-indicators” new releases) focuses on quarterly and annual aggregates for the European Union. These data comply with international standards, particularly those set out in the IMF’s Balance of Payments Manual (fifth edition). The aggregates for the euro area and the European Union are compiled consistently on the basis of transactions and positions with residents of countries outside the euro area and the European Union respectively.
A complete set of updated euro area balance of payments (including a quarterly geographical breakdown by main counterparts) and international investment position statistics is available in the “Statistics” section of the ECB’s website under the headings “Data services”/“Latest monetary, financial markets and balance of payments statistics”. These data, as well as historical euro area balance of payments time series, can be downloaded from the ECB’s Statistical Data Warehouse (SDW). Data up to February 2010 will also be published in the May 2010 issues of the ECB’s Monthly Bulletin and Statistics Pocket Book. Detailed methodological notes are available on the ECB’s website. The next press release on the euro area monthly balance of payments will be published on 21 May 2010. The next press release including quarterly international investment position will be published on 19 July 2010.
Annexes
Table 1: Current account of the euro area
Table 2: Monthly balance of payments of the euro area
Table 3: Quarterly international investment position of the euro area
European Central Bank
Directorate General Communications
- Sonnemannstrasse 20
- 60314 Frankfurt am Main, Germany
- +49 69 1344 7455
- media@ecb.europa.eu
Reproduction is permitted provided that the source is acknowledged.
Media contacts