
Euro area international investment position and its geographical breakdown (as at end-2006)
The international investment position of the euro area vis-à-vis the rest of the world recorded net liabilities of EUR 1.0 trillion (representing 12% of euro area GDP) at the end of 2006. Compared with the end of 2005, the net liability position increased by EUR 187 billion. This higher net liability position was mainly the result of revaluation effects due to movements in exchange rates (EUR 152 billion) and net financial transactions (EUR 118 billion).
Concerning the euro area direct investment abroad position at the end of 2006, 26% was invested in the United Kingdom and 20% in the United States; at the same time, almost two-thirds of the stock of foreign direct investment in the euro area originated from these two countries. The portfolio investment of euro area residents mainly concerned securities issued in the United States (33%) and in the United Kingdom (23%).
This press release includes for the first time a breakdown of the change in the annual international investment position by type of adjustment. Furthermore, Brazil, Russia, India and China, as well as Hong Kong, are now separately reported in the geographical breakdown. A third innovation is that it also contains the valuation of direct investment by type of equity.
The international investment position as at end-2006
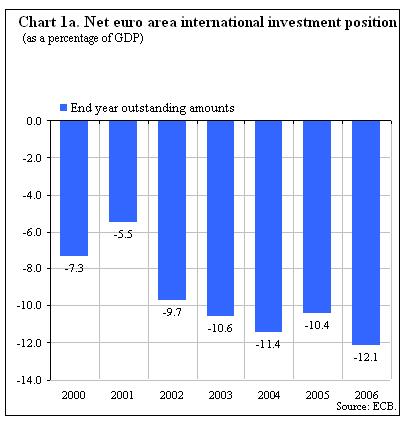
At the end of 2006, the international investment position (i.i.p.) of the euro area vis-à-vis the rest of the world recorded net liabilities of EUR 1.0 trillion (representing 12% of euro area GDP). This reflects an increase of EUR 187 billion in net liabilities as compared with the revised end-2005 position, which represented 10% of euro area GDP (see Chart 1a).
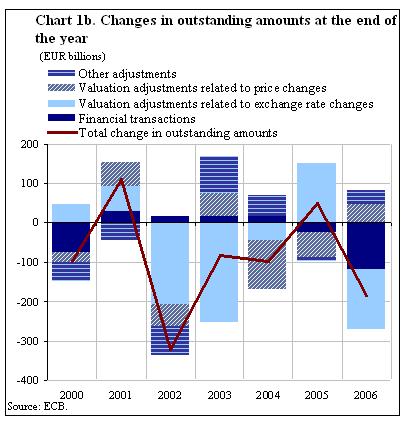
The increase in the net liability position between end-2005 and end-2006 was mainly due to revaluation effects resulting from movements in exchange rates (EUR 152 billion) and net financial transactions (EUR 118 billion) (see Chart 1b).
The net financial transactions were largely driven by net increases in portfolio investment liabilities, i.e. net purchases of euro area bonds and notes (EUR 500 billion) and equity securities (EUR 309 billion) by non-residents, which were only partly offset by net increases in portfolio investment assets (EUR 535 billion).
The changes in outstanding amounts related to exchange rate variations broadly reflected the appreciation of the euro in 2006. As the euro area external assets are mostly denominated in foreign currencies and its external liabilities in euro, an appreciation of the euro results in a lower euro value of external assets and thus an increase of the net international liability position of the euro area. In 2006, this increase was mainly due to revaluations of direct investment (EUR 80 billion) and to a lesser extent portfolio investment (EUR 34 billion) and other investment (EUR 23 billion).
The i.i.p. adjustments reflecting asset price changes amounted to EUR 46 billion in 2006. These mainly resulted from revaluations of direct investment abroad (EUR 76 billion) and of foreign equity securities held by euro area residents (EUR 249 billion), which were only partly offset by the revaluation of euro area equity securities held by non-residents (EUR 297 billion).
At the end of 2006, the value of euro area direct investment in equity of foreign companies amounted to EUR 2.5 trillion, of which the investment in companies that are not listed on foreign stock exchanges totalled EUR 2.2 trillion. The market value of euro area direct investment in foreign listed companies was EUR 0.2 trillion (EUR 0.1 trillion at book value) and investment in real estate outside the euro area equalled EUR 0.1 trillion. In turn, foreigners’ direct investment in the equity of euro area companies reached EUR 2.0 trillion, of which EUR 1.9 trillion in euro area unlisted companies, EUR 0.1 trillion in euro area listed companies and EUR 0.1 trillion in real estate.
The geographical breakdown of the international investment position as at end-2006
At the end of 2006, the stock of euro area direct investment abroad amounted to EUR 3.1 trillion, 74% of which was invested in the United Kingdom (EUR 804 billion), the United States (EUR 608 billion), offshore financial centres (EUR 329 billion), Switzerland (EUR 300 billion) and other EU countries (EUR 225 billion). The total euro area direct investment in Brazil, Russia, India and China (the BRIC group of countries) amounted to EUR 154 billion. The stock of foreign direct investment in the euro area amounted to EUR 2.7 trillion, 83% of which originated from the United Kingdom (EUR 1.0 trillion), the United States (EUR 633 billion), offshore financial centres (EUR 335 billion) and Switzerland (EUR 222 billion). The United Kingdom was the most important net investor in the euro area (EUR 219 billion).
With regard to portfolio investment, euro area holdings of foreign securities amounted to EUR 4.4 trillion at the end of 2006, which largely reflected holdings of securities issued in the United States (EUR 1.5 trillion), the United Kingdom (EUR 1.0 trillion) and offshore financial centres (EUR 528 billion). The euro area holdings of securities issued in the BRIC countries equalled EUR 160 billion. Foreign holdings of euro area securities amounted to EUR 6.0 trillion at the end of 2006.
Turning to other investment (e.g. bank loans), the outstanding amount of euro area holdings abroad was EUR 4.4 trillion at the end of 2006, 45% of which was invested in the United Kingdom, 13% in the United States and 10% in offshore financial centres. The other investment in the euro area amounted to EUR 4.6 trillion at the end of 2006, of which the United Kingdom accounted for 41%, the offshore financial centres for 14% and the United States for 13%.
Data revisions
This press release incorporates a revised set of balance of payments (b.o.p.) and i.i.p. statistics since 1999, in addition to the end-2006 i.i.p. data.
The revisions of the 2003 b.o.p. mainly concerned portfolio investment liabilities. The revisions of the 2005 current account data mainly concerned income from direct and portfolio investments and resulted in an increase of the current account balance by EUR 10.4 billion to EUR 8.5 billion. The other b.o.p. revisions have not significantly affected the previously published data.
Some methodological improvements have been incorporated in the recording of end-period positions of financial derivatives and trade credits (which are part of the other investment account). Revisions of the i.i.p. resulted in a slightly lower euro area net liability position for the years 1999 through 2002 and a higher net liability position for the years 2003 through 2005. Finally, compared with the previously published results for the fourth quarter of 2006, the euro area net liability position at end-2006 was EUR 35 billion lower.
Additional information on the euro area balance of payments and international investment position
This press release contains for the first time a breakdown of the change in the annual i.i.p. by revaluations resulting from price variations, exchange rate changes, and other adjustments (e.g. reclassifications between items, write-downs, changes in survey coverage). This breakdown is obtained by modelling the i.i.p. changes other than transactions with information from the geographical breakdown and currency composition of assets and liabilities, as well as price indices for different financial assets.
Additionally, this press release contains a breakdown of direct investment equity into investment in listed companies, unlisted companies and real estate. While direct investment in listed companies is valued at market prices observed in stock exchanges, the investment in unlisted companies is valued based on the books of the companies being financed. For analytical purposes, the valuation of listed companies at book value is also provided as a memorandum item, although it is not considered in the calculation of total direct investment.
Finally, the tables of the press release contain further counterparts (Brazil, mainland China, Hong Kong, India and Russia) in the geographical breakdown of the annual i.i.p.. While for the moment the financial positions of the euro area in those countries are still limited, their financial markets are growing rapidly.
Geographical details of the annual i.i.p. of the euro area are not available for the items portfolio investment liabilities, financial derivatives and reserve assets
A complete set of updated euro area b.o.p. and i.i.p. is available on the ECB’s website in the “Statistics” section under the headings “Data services”/“Latest monetary, financial markets and balance of payments statistics”. These data, as well as the historical euro area b.o.p. and i.i.p. time series, can be downloaded from the ECB’s Statistical Data Warehouse (SDW). The results will be published in the December 2007 issues of the ECB’s Monthly Bulletin and Statistics Pocket Book. A detailed methodological note is available on the ECB’s website. The next quarterly press release on the euro area b.o.p. (including geographical details) and i.i.p. will be published on 18 January 2008.
Annexes
Table 1 – International investment position of the euro area, including breakdown of changes from end-2005 to end-2006
Table 2a – Geographical breakdown of the euro area international investment position (end-2006)
Table 2b – Geographical breakdown of the euro area international investment position (end-2005)
Table 3 – Revisions of the euro area balance of payments and international investment position (difference vis-à-vis previously published data)
European Central Bank
Directorate General Communications
- Sonnemannstrasse 20
- 60314 Frankfurt am Main, Germany
- +49 69 1344 7455
- media@ecb.europa.eu
Reproduction is permitted provided that the source is acknowledged.
Media contacts